Domino's Pizza Enterprises
This analysis is based on closing-price data as of October 16, 2026. Whether you're researching Domino's Pizza Enterprises (DMP) on the ASX or learning how to read stock charts, here are objective support, resistance and technical invalidation levels built from the RSI, MACD and ATR indicators.
Domino's Pizza Enterprises closed at $21.40 on October 16, 12.9% below the $24.58 52-week high and 44.3% above the $14.83 52-week low. The two-year chart is still a story of recovery inside a larger decline — a slide from the mid-$30s in late 2024 to a low near $13 in late 2025, a rebound to the $24 area in early 2026, a second base around $15–$17 through mid-2026, and a climb since August. After a sharp run to a $22.20 close on Oct 9, the last week has been a shallow pullback on heavier volume: the SMA5 > SMA20 > SMA60 ordering that re-formed on Sep 30 is intact and relative strength against the S&P/ASX 200 remains positive, but it has cooled from last week's peak, the MACD histogram is shrinking and a bearish OBV divergence is still flagged on both frames.
Snapshot as of October 16, 2026
| Item | Value | Reading |
|---|---|---|
| Close | $21.40 | −12.9% from 52w high · +44.3% from 52w low |
| 52-week range | $14.83 – $24.58 | Close in the upper half of the range, below the early-2026 peak area |
| SMA 5 / 20 / 60 | $21.65 / $20.46 / $19.75 | SMA5 > SMA20 > SMA60 (re-established Sep 30). Close is 1.1% under SMA5, 4.6% over SMA20 and 8.4% over SMA60 |
| Bollinger (20) | $22.73 / $20.46 / $18.19 | Band width 22.22%; close back inside the band, 5.9% below the upper band |
| aVWAP (2y anchor Jul 2, 2025) | $18.04 | Price 18.7% above the long-horizon anchored average |
| aVWAP (90d anchor Aug 26, 2026) | $20.03 | Price 6.8% above the average anchored to the Aug 26 bar |
| RSI(14) | 59.5 | Eased from near 70 last week; no RSI divergence flagged |
| Mansfield RS (vs the S&P/ASX 200) | +11.73% | Outperforming, slope rising; −6.23 points on the week (slowing) and +9.45 points on the month (accelerating) |
| MACD (12,26,9) | 0.6202 / 0.5204 / +0.0997 | Golden cross on Sep 30 still in force; histogram narrowing as the MACD line flattens |
| ADX(14) | 25.3 | Strong-trend threshold on the 90-day frame; 25.0 (emerging) on the two-year frame |
| ATR(14) | $0.720 (3.4%) | 2×ATR spans 6.7% of the share price |
| OBV (2y / 90d) | early accumulation / accumulation | Above MA20 on both frames (2y flat, 90d rising); bearish OBV divergence flagged on both (Aug 31 vs Oct 9) |
| Volume vs 20d avg | 2.145× | 836,673 shares against a 390,101 average, on a −0.79% day; roughly 2.4× after adjusting for the 0.89× universe median on Oct 16 |
| 1×ATR / 2×ATR technical invalidation | $20.68 / $19.96 | Volatility-based structural reference levels below the close |
① Price & Moving Averages
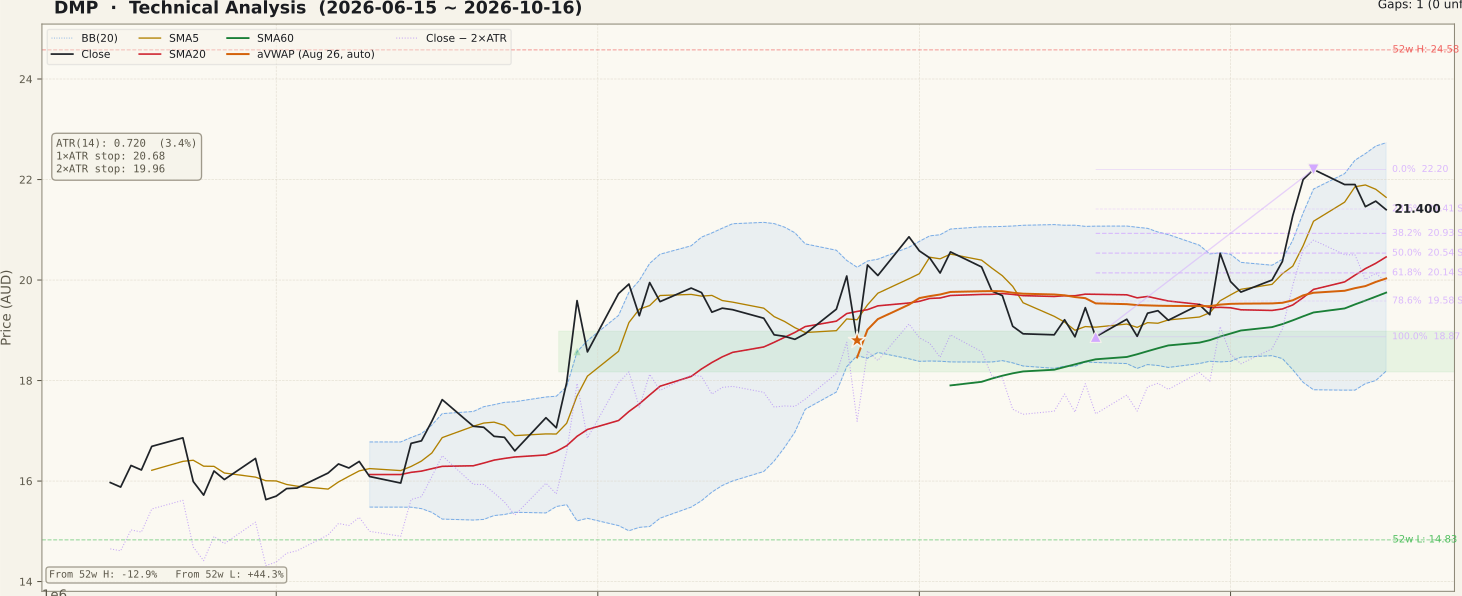
DMP_price-90d-2026-10-18.svgThe two-year frame frames the current move. From the mid-$30s in late 2024 the share price fell to a low near $13 in late 2025, rebounded to the $24 area by early 2026 (the $24.58 52-week high), then slid back into a $15–$17 base that lasted into July 2026. SMA60 has turned up since the third quarter and price has worked higher since early August, but it remains below the early-2026 peak zone. There are no unfilled gaps on either frame.
On the 90-day frame, price ranged roughly between $18.80 and $20.90 through late August and September, then broke higher. The timing of each condition in the current run: the close has held above SMA60 since Jul 14; the close above SMA20, SMA5 above SMA20, the full SMA5 > SMA20 > SMA60 ordering and the MACD crossover above its signal line were all re-established together on Sep 30 (+6.32% on 1.60× volume), 13 sessions ago. The Oct 7 (+4.47%) and Oct 8 (+3.38%) sessions then carried price to 20-session closing highs on Oct 7, 8 and 9.
The past week gave some of that back. From the $22.20 close on Oct 9 — the 0% end of the Fibonacci swing from the $18.87 low on Sep 18 — price eased to $21.40, which sits fractionally below the 23.6% retracement ($21.41; the data tags this level as support, but on this close it is a cent overhead) and 1.1% under SMA5. The next retracements are 38.2% at $20.93 and 50% at $20.54, with SMA20 at $20.46 just beneath. Price has moved back inside the Bollinger Bands after riding above the upper band last week, which reads as the stretch unwinding rather than the trend breaking.
② Volume

DMP_volume-90d-2026-10-18.svgThe two most recent sessions were the busiest of the past week. Oct 15 traded 780,008 shares (about 1.9× the prior 20-day average) for a +0.51% close, and Oct 16 traded 836,673 shares — 2.145× the 20-day average including that day — for a −0.79% close. In both sessions price closed below its open after trading higher intraday (Oct 15 reached $22.07; Oct 16 opened at its $21.86 high and dipped to $21.10), so the extra volume met supply near the recent highs rather than lifting price.
The market backdrop was ordinary rather than heavy: the median stock in the screened ASX universe traded 0.62–1.28× its own average across Oct 12–16 (0.89× on Oct 16). Adjusted for that, DMP's Oct 15 and Oct 16 activity was roughly 1.5× and 2.4× the market's typical participation — elevated, though short of the 3× level that would mark an exceptional volume event. No company announcement has been identified to explain the higher turnover; the cause is not known. These adjustments are approximate.
③ MACD

DMP_macd-90d-2026-10-18.svgThe MACD line is 0.6202 against a signal of 0.5204, a histogram of +0.0997. The golden cross from Sep 30 is still in force and both lines are above zero, but the histogram has narrowed for several sessions since its early-October peak and the MACD line has flattened and turned slightly lower. That is a loss of upside momentum, not a bearish crossover; a cross below the signal line would be the next step that changes the reading. As last week, the MACD line remains below its August peak.
④ RSI

DMP_rsi-90d-2026-10-18.svgRSI(14) is 59.5 (also 59.5 on the two-year frame), down from just under 70 around the Oct 9 high. The pullback has relieved the near-overbought reading without pushing RSI below the 50 midline, which it has held since late September. No RSI divergence is flagged in the data. A reading in the high 50s is neutral-to-firm; a slip under 50 would suggest the short-term momentum from the Sep 30 breakout has been spent.
⑤ Mansfield Relative Strength

DMP_rs-90d-2026-10-18.svgMansfield RS vs the S&P/ASX 200 is +11.73%, outperforming with a rising slope. A week earlier it was +17.96 and a month earlier +2.27, so it gave back 6.23 points on the week while still up 9.45 points on the month — positive but slowing on the weekly view, positive and accelerating on the monthly view. On the two-year chart, RS spent most of 2025 deeply negative (near −50 at the worst), recovered to around zero in early 2026, dipped again through mid-2026, and has held above zero since August. The current reading is still among the higher levels of the two-year window, even after this week's dip.
⑥ ATR & ADX

DMP_atr_adx-90d-2026-10-18.svgATR(14) is $0.720, or 3.4% of price, placing the 1×ATR reference at $20.68 and the 2×ATR technical invalidation level at $19.96, 6.7% below the close. ATR has drifted up slightly over the past week, consistent with wider intraday ranges on the higher-volume sessions. ADX is 25.3 on the 90-day frame (strong-trend threshold) and 25.0 on the two-year frame (classed as emerging) — effectively right at the 25 line, having climbed from around 20 in early October. ADX measures strength, not direction: it says the move since Sep 30 has gained persistence, not that it will continue upward.
⑦ OBV

DMP_obv-90d-2026-10-18.svgOBV is tagged accumulation on the 90-day frame (above MA20, rising) and early accumulation on the two-year frame (above MA20, flat). The caution from last week has not cleared: a bearish OBV divergence is flagged on both frames. On the 90-day frame, the Aug 31 peak came at a price of $20.86 with OBV at 2,692,445, while the Oct 9 peak came at a higher price of $22.20 with OBV at only 952,438 (the two-year frame shows the same pattern, −1,572,717 then −3,312,724, on a different cumulative baseline). The heavy Oct 16 down session subtracted its full 836,673 shares from OBV, so the line has not moved toward resolving that gap.
The OBV-to-MA20 gap is +10.73% on the two-year frame; the 90-day figure of +130.23% is not a reliable strength gauge because the 90-day MA20 sits near zero. These percentages measure distance from the moving average, not divergence. A divergence signals the possibility of a stalling move, not a confirmed top — it needs price follow-through to matter.
Bull Case vs Bear Case
Bull Case
- SMA5 > SMA20 > SMA60 ordering intact since Sep 30; close above SMA60 since Jul 14
- Mansfield RS +11.73% vs the S&P/ASX 200, up 9.45 points on the month
- MACD golden cross (Sep 30) still in force with both lines above zero
- ADX 25.3 — the advance has gained persistence on the 90-day frame
- RSI 59.5 has cooled from near 70 while holding above 50
- Price above both anchored VWAPs — $18.04 (Jul 2, 2025) and $20.03 (Aug 26, 2026)
Bear Case
- Bearish OBV divergence on both frames — higher price on Oct 9 than Aug 31, lower OBV
- Oct 15–16 closed below their opens on about 1.9× and 2.1× average volume, near the highs
- MACD histogram narrowing; MACD line flattening below its August peak
- Mansfield RS gave back 6.23 points on the week
- Close $21.40 is 1.1% under SMA5 and a cent below the 23.6% retracement
- No company announcement identified for the recent elevated volume; still 12.9% under the 52-week high
Scenarios
| Scenario | Probability | Path | Trigger / Invalidation |
|---|---|---|---|
| Pullback holds and the trend resumes | 40% | Price finds support in the $20.46–$20.93 area (38.2% retracement, 50% retracement and SMA20), RSI holds near 50, and the advance resumes toward the $22.20 swing high | Trigger: a close back above SMA5 ($21.65) followed by a close above $22.20 with OBV improving. Invalidation: closes below SMA20 ($20.46) |
| Range above SMA20 | 35% | Price consolidates between roughly $20.50 and $22.20 while the MACD histogram and RSI reset, with no resolution of the OBV divergence either way | Trigger: continued closes between SMA20 and $22.20. The structure holds while closes stay above $19.96 |
| Pullback deepens toward the August–September range | 25% | The OBV divergence resolves lower, MACD crosses below its signal line and price slips through SMA20 toward the 90-day aVWAP ($20.03) and the $19.96 level | Trigger: a daily close below $19.96 (2×ATR technical invalidation) |
Key Levels & Volatility References
| Level | Role | Distance | Basis |
|---|---|---|---|
| $24.58 | Resistance | +14.9% | 52-week high, the top of the early-2026 rally |
| $22.20 | Resistance | +3.7% | Oct 9 close — 0% of the Fibonacci swing and the recent 20-session high; upper Bollinger Band ($22.73) above |
| $21.40 | Current | — | Oct 16, 2026 close; 23.6% retracement ($21.41) and SMA5 ($21.65) just overhead |
| $20.93 | Support | −2.2% | Fibonacci 38.2% retracement of the Sep 18 – Oct 9 swing; Aug 31 closing high ($20.86) and 1×ATR reference ($20.68) below |
| $20.46 | Support | −4.4% | SMA20 / Bollinger mid line, with the 50% retracement ($20.54) alongside |
| $20.03 | Support | −6.4% | 90-day aVWAP anchored Aug 26, 2026 |
| $19.96 | Invalidation | −6.7% | 2×ATR technical invalidation level |
What to Watch
- OBV versus price. The bearish divergence (Aug 31 vs Oct 9) is still open. An OBV recovery toward its Aug 31 peak would remove it; further heavy down sessions would deepen it.
- The $20.46–$20.93 area. The 38.2% and 50% retracements and SMA20 form the first support cluster. Closes holding above it would keep the pullback shallow.
- Volume character. Oct 15–16 brought about 2× volume on closes below the open. Whether the next heavy sessions close up or down will show which side is absorbing the supply.
- MACD versus its signal line. The histogram is narrowing toward zero; a bearish crossover would mark a turn in short-term momentum.
- The $19.96 level. A daily close below the 2×ATR technical invalidation level would undo the structure built since Sep 30.