Guzman Y Gomez
This analysis is based on closing-price data as of October 16, 2026. Whether you're researching Guzman Y Gomez (GYG) on the ASX or learning how to read stock charts, here are objective support, resistance and technical invalidation levels built from the RSI, MACD and ATR indicators.
Over two years, Guzman Y Gomez fell from the mid-$40s in early 2025 to a 52-week low of $15.06, then turned up from mid-2026 and has recovered to $26.59 — still 11.7% under the $30.11 52-week high set in the late-August spike. The current setup is a pullback: after a late-September low at $24.50 and a run to $27.09 on October 8, price has eased back to sit 3.1% above the 20-day line, with the MACD in a fresh golden cross and Mansfield RS at +21.6% vs the S&P/ASX 200. The lens here is whether this shallow pullback holds above the flat, closely stacked SMA20/SMA60 pair — the two lines are not yet in bullish order, and the RSI shows a bearish divergence against a bullish OBV divergence.
Snapshot as of Oct 16, 2026 close
| Item | Value | Read |
|---|---|---|
| Close | $26.59 | −11.7% from 52w high $30.11 · +76.6% from 52w low $15.06 |
| SMA5 / SMA20 / SMA60 | $26.81 / $25.79 / $25.89 | Close below SMA5, above SMA20 (+3.1%) and SMA60; SMA20 sits $0.10 under SMA60 — not aligned |
| Bollinger (20, 2) | $27.64 / $25.79 / $23.94 | Upper half of the band · width 14.37% |
| aVWAP 90d (Aug 21, 2026 anchor) | $26.85 | Close 1.0% below — overhead short-term cost basis |
| aVWAP 2y (Aug 22, 2025 anchor) | $22.64 | Close well above — long-term cost basis in profit |
| RSI(14) | 55.5 | Neutral-positive · bearish divergence flagged |
| Mansfield RS vs S&P/ASX 200 | +21.6% | Outperform · −1.01 pts on the week, +3.12 pts on the month |
| MACD (12,26,9) | 0.294 / 0.152 / +0.142 | Golden cross Oct 6, above zero |
| ADX(14) | 23.0 (90d) · 22.5 (2y) | Emerging trend strength |
| ATR(14) | $1.00 (3.8%) | Moderate daily range |
| OBV 2y / 90d | Accumulation · rising / Accumulation · rising | Above MA20 on both · bullish OBV divergence flagged |
| Volume | 323,894 (0.77× 20d avg 420,717) | Light on the Friday close |
| 1×ATR / 2×ATR technical invalidation | $25.59 / $24.59 | 2×ATR level 7.5% below the close |
① Price & Moving Averages
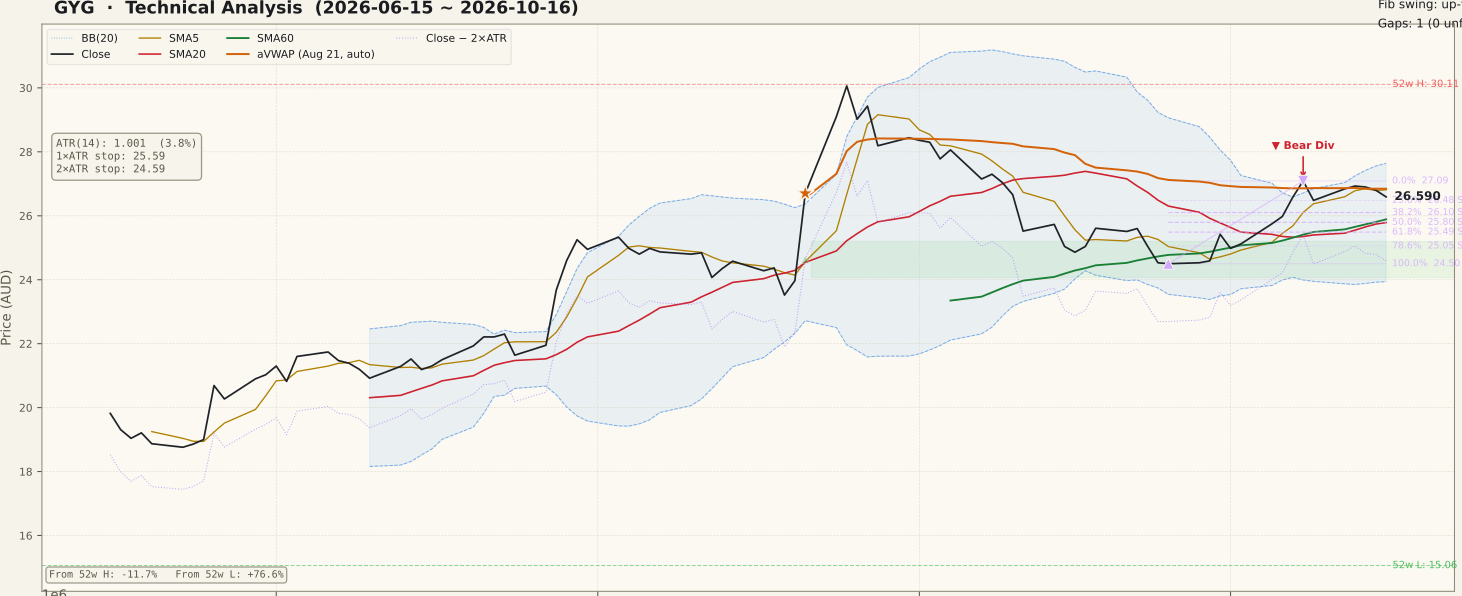
GYG_price-90d-2026-10-18.svgThe two-year chart is a long decline from the early-2025 highs, a base between roughly $15 and $20 through the first half of 2026, and a recovery that carried price above the falling-then-flattening SMA60 from mid-year. The late-August spike to the $30.11 52-week high faded through September to a $24.50 low on September 25, and the recovery from there reached a $27.09 close on October 8 before easing to $26.59.
On the 90-day Fibonacci (Sep 25 low $24.50 to Oct 8 high $27.09), Friday's close sits just above the 23.6% retracement at $26.48; the 38.2% level is $26.10 and the 50% level $25.80, which nearly coincides with SMA20 ($25.79) and SMA60 ($25.89). The two-year Fibonacci (Aug 19 low $23.52 to Aug 25 high $30.06) places the close between its 50% ($26.79) and 61.8% ($26.02) levels — the 23.6% ($28.52), 38.2% ($27.56) and 50% levels of that swing currently sit above price, so they function as overhead references even though the tool labels the up-swing retracements as support.
The moving-average structure is mixed rather than clean: SMA5 is above SMA20, and price is above both longer lines, but SMA20 is still $0.10 below SMA60, so the full SMA5 > SMA20 > SMA60 ordering has not formed. Price is just under the 90-day anchored VWAP ($26.85) and well above the two-year anchored VWAP ($22.64). There are no unfilled gaps on either timeframe.
② Volume

GYG_volume-90d-2026-10-18.svgFriday's 323,894 shares were 0.77× the 20-day average of 420,717 — a light close. Across the ASX the week was quiet to normal, with universe median volume ratios between 0.62× and 1.28×.
The standout bar is October 13: volume of roughly 4.8× its prior 20-day average (about 5.6× after adjusting for the market) on a close only 0.34% higher. October 14 followed at about 2.3× (about 2.9× market-adjusted) on a −0.11% close. Volume rose sharply without a large price change, and no specific catalyst for those two sessions was identified. Heavy turnover with little net price movement can reflect position transfer in either direction, so it is described here as a fact rather than read as a signal.
For context outside the current window, the 20-day-high breakouts of August 21 and August 24 came on heavy volume during the FY results period. The pullback conditions in the current setup — price back above SMA60 (Oct 2) and SMA20 (Oct 5), SMA5 above SMA20 (Oct 6) — re-formed on below-average volume.
③ MACD

GYG_macd-90d-2026-10-18.svgThe MACD line (0.294) crossed above its signal line (0.152) on October 6 from just below zero, and both lines are now above zero with a positive histogram of +0.142. That is an early-stage improvement after the September decline took the MACD into negative territory.
The histogram has been flattening over the last few sessions as price eased from the October 8 high, so momentum is positive but no longer expanding. A histogram that keeps shrinking toward zero would be the first sign that the October 6 cross is losing traction.
④ RSI

GYG_rsi-90d-2026-10-18.svgRSI(14) is 55.5 — above the 50 midline, far from overbought. It rose from the low 40s in late September to the low 60s around October 8, then eased back.
The data flags a bearish RSI divergence: on August 3 price was $25.33 with RSI at 80.04 (78.22 on the two-year calculation), while on October 8 a higher price of $27.09 came with RSI at only 62.52. Higher price with lower momentum is a caution flag, not a confirmed top — it needs follow-through such as a break below the nearby retracement levels before it carries weight.
⑤ Mansfield Relative Strength vs the S&P/ASX 200

GYG_rs-90d-2026-10-18.svgMansfield RS is +21.6% vs the S&P/ASX 200 and rising — a clear outperformer. On the two-year chart this is notable because RS spent most of 2025 and the first half of 2026 below zero, at times near −40%, and only crossed back above zero around July–August 2026.
Short-term the picture is slightly mixed: RS is 1.01 points lower than a week ago (22.59), so outperformance is slowing on the week, but 3.12 points higher than a month ago (18.45), so the monthly trend is still accelerating. Relative strength is the strongest element of this setup.
⑥ ATR · ADX

GYG_atr_adx-90d-2026-10-18.svgATR(14) is $1.00, or 3.8% of price. It peaked above $1.20 during the late-August spike, declined through September, and ticked up again in October as the October 9 and October 14 sessions produced wide intraday ranges.
ADX is 23.0 on the 90-day calculation (22.5 on two years) — in the 20–25 "emerging" band. That says a trend is forming but is not yet strong, which fits a pullback inside a recovering structure rather than a powerful directional move. The 1×ATR reference is $25.59 and the 2×ATR technical invalidation level is $24.59, 7.5% below the close and just above the September 25 swing low of $24.50.
⑦ OBV

GYG_obv-90d-2026-10-18.svgOBV is in accumulation on both timeframes — above its 20-day average and rising (two-year: 28.55% above its MA20; 90-day: 9.91% above). The two-year OBV line has climbed out of a deep trough that lasted from mid-2025 to May 2026, in step with the price recovery.
The data also flags a bullish OBV divergence: price was $28.19 on August 28 and a lower $26.59 on October 16, while OBV stood higher at the second point. Much of that OBV gain came from the heavy October 13–14 volume on nearly flat closes, so the reading leans on two sessions whose cause is unidentified. Read alongside the bearish RSI divergence, the two oscillators point in opposite directions — momentum has cooled while volume flow has held up.
Bull Case vs Bear Case
Bull Case
- Mansfield RS +21.6% vs the S&P/ASX 200, +3.12 pts on the month
- MACD golden cross on Oct 6, both lines above zero
- Close above SMA20 ($25.79) and SMA60 ($25.89), with SMA5 above SMA20
- Pullback holding the 23.6% retracement ($26.48) of the Sep 25–Oct 8 swing
- OBV in accumulation on both timeframes, with a bullish OBV divergence
- Price far above the two-year anchored VWAP ($22.64)
Bear Case
- SMA20 still below SMA60 — no bullish moving-average ordering
- Bearish RSI divergence: $27.09 at RSI 62.52 vs $25.33 at RSI 80.04
- Close just under the 90-day aVWAP ($26.85) and below SMA5 ($26.81)
- ADX 23.0 — trend strength only emerging
- Oct 13–14 heavy volume on flat closes has no identified cause
- RS slowing on the week (−1.01 pts); 52-week high 11.7% above
Scenarios
| Scenario | Probability | Path | Trigger / Invalidation |
|---|---|---|---|
| Consolidation above the moving averages | 40% | Range between roughly $25.80 and $27.09 while SMA20 rises toward and through SMA60 | Holds above the $25.79–$25.89 SMA cluster; invalidated by a close below $25.59 (1×ATR) |
| Pullback resolves higher | 35% | Reclaim of the $26.85 aVWAP, then a close above the $27.09 Oct 8 high toward $27.56–$27.64 (2y 38.2% / upper band) | Close above $27.09 with above-average volume; fails if RSI cannot clear its Oct 8 reading |
| Pullback deepens | 25% | Break of the SMA cluster toward the 61.8%–78.6% retracements ($25.49–$25.05) and the Sep 25 low | Close below $25.79 on rising volume; structure ends below $24.59 (2×ATR) |
Key Levels & Volatility References
| Price | Role | Basis |
|---|---|---|
| $27.09 | Resistance | Oct 8 swing high (0% of the 90d swing) · RSI divergence point |
| $26.85 | Resistance | 90-day anchored VWAP (Aug 21, 2026 anchor) |
| $26.59 | Current | Oct 16 close |
| $26.48 | Support | 23.6% retracement of the Sep 25–Oct 8 swing |
| $26.10 | Support | 38.2% retracement of the Sep 25–Oct 8 swing |
| $25.89 / $25.79 | Support | SMA60 / SMA20 cluster (50% retracement $25.80) |
| $24.59 | Invalidation | 2×ATR technical invalidation level (close − 2×$1.00) |
What to Watch
- Whether SMA20 ($25.79) crosses above SMA60 ($25.89) to complete the moving-average ordering.
- A daily close back above the 90-day aVWAP ($26.85) and the $27.09 October 8 high, and the volume behind it.
- RSI behaviour on any new high — a reading above 62.52 would ease the bearish divergence.
- Whether the October 13–14 volume is followed by price direction, or fades as a one-off.
- The MACD histogram: holding positive keeps the October 6 cross intact; a slide toward zero weakens it.