PWR Holdings Limited
This analysis is based on closing-price data as of July 31, 2026. Whether you're researching PWR Holdings Limited (PWH) on the ASX or learning how to read stock charts, here are objective support, resistance and technical invalidation levels built from the RSI, MACD and ATR indicators.
PWR Holdings has climbed back to within 2.8% of its 52-week high at $10.21, capping a three-week advance of roughly 17.7% off the July 10 low at $8.43. The two-year chart shows a stock that spent most of 2025 underperforming before turning up in early 2026; relative strength versus the S&P/ASX 200 is now firmly positive at +12.8% and rising. Short-term momentum is constructive — a MACD golden cross on July 2, a resolved bullish RSI divergence and 90-day OBV in accumulation — but the price is pressing straight into a resistance cluster ($10.18 upper Bollinger Band, $10.21 high) with the RSI at 66.3, so the next few sessions are more about how the stock behaves at the ceiling than about chasing it.
Snapshot as of July 31, 2026
| Item | Value | Reading |
|---|---|---|
| Close | $9.92 | −2.8% from 52w high · +45.9% from 52w low |
| 52-week range | $6.80 – $10.21 | Upper end of the yearly range |
| SMA 5 / 20 / 60 | $9.78 / $9.19 / $8.91 | Bullish alignment — close above all three, stack rising |
| Bollinger (20) | $10.18 / $9.19 / $8.20 | Band width 21.5% — expanded; price near the upper band |
| aVWAP (2y anchor Nov 20, 2024) | $7.84 | Price well above — long-horizon holders in profit |
| aVWAP (90d anchor Jun 10, 2026) | $8.75 | Price above — recent positioning is onside |
| RSI(14) | 66.3 | Strong but nearing the 70 overbought line; bullish divergence resolved |
| Mansfield RS (vs the S&P/ASX 200) | +12.8% | Outperforming, slope rising (+0.8 w/w; −4.4 a month ago) |
| MACD (12,26,9) | 0.34 / 0.26 / +0.08 | Golden cross Jul 2, 2026 — histogram widening |
| ADX(14) | 23.7 | Emerging trend — not yet an established one (>25) |
| ATR(14) | $0.44 (4.5%) | Moderate-to-high daily range for the price point |
| OBV (2y / 90d) | early accumulation / accumulation | 90d above its MA20 and rising; 2y above MA but flat — long-horizon lag |
| Volume vs 20d avg | 1.3× | Advance carried on above-average, not exceptional, volume |
| 1×ATR / 2×ATR technical invalidation | $9.48 / $9.04 | Volatility-based structural reference levels below the close |
① Price & Moving Averages
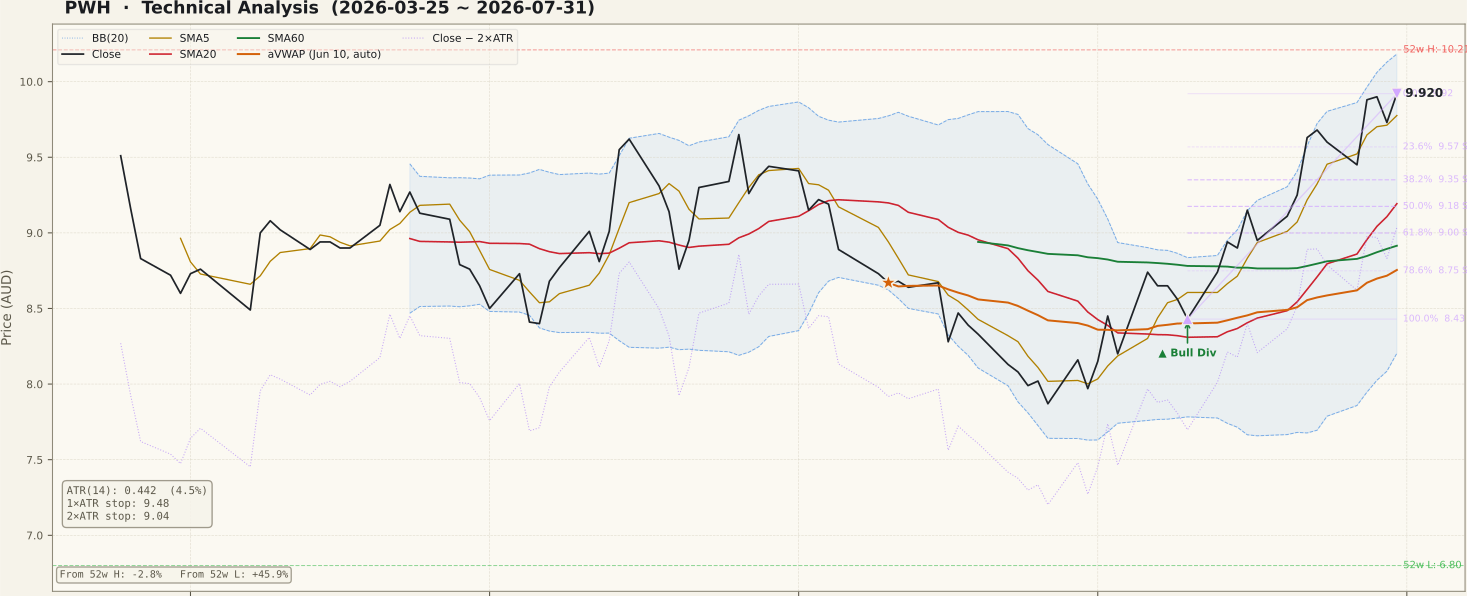
PWH_price-90d-2026-08-02.svgThe 90-day window tells a clean recovery story: a slide from the May–June range into the July 10 low at $8.43, then a near-vertical repair leg that reclaimed the SMA20 ($9.19), the SMA60 ($8.91) and both anchored VWAPs in under three weeks. The stack is now fully bullish — close $9.92 above a rising SMA5 ($9.78), which sits above the SMA20, which sits above the SMA60 — the configuration trend-followers look for. On the two-year chart the picture is a long 2025 base between roughly $6 and $8 that resolved upward in early 2026; the current push is an attack on the top of the entire two-year range.
The immediate ceiling is dense: the upper Bollinger Band at $10.18 and the 52-week high at $10.21 sit within pennies of each other, and above that the two-year chart carries an unfilled gap from August 16, 2024 spanning $10.66–$11.47 — a supply zone left over from the original decline. Band width at 21.5% is expanded, meaning the move has already stretched volatility; riding the upper band is what strong trends do, but it also means the price is extended relative to its 20-day mean at $9.19. A pause or retracement toward the $9.57–$9.18 area would be normal behaviour rather than a structural failure.
② Volume

PWH_volume-90d-2026-08-02.svgFriday's session printed 258,548 shares against a 20-day average of 196,731 — a Vol/Avg ratio of 1.3×. That is confirmation-grade rather than climax-grade: the July advance has been carried on consistently above-average green volume, which is what a healthy repair leg should look like, but there has been no 2×+ conviction spike on the push toward the highs themselves.
One structural caution: at roughly 197,000 shares a day, PWH's dollar turnover is modest and sits near the lower bound of our liquidity screen. In names this thin, single large prints can distort volume and OBV readings, bid-ask spreads are wider, and slippage on fast moves is a real cost. Volume-based signals here deserve a lower confidence weighting than they would in a deeply traded large-cap, and any breakout reading should be cross-checked against price structure rather than taken from volume alone.
③ MACD

PWH_macd-90d-2026-08-02.svgMACD crossed above its signal line on July 2, 2026 — a golden cross that formed well below the zero line near the price low, which is the early-cycle variety with the most room to run. Since then the line has climbed through zero to 0.34, the signal sits at 0.26, and the histogram is positive and widening at +0.08. Momentum is unambiguous here: each leg of the July advance has been confirmed by a fresh histogram expansion, with no fading divergence in the MACD itself yet. The item to monitor is the first histogram contraction while price stalls under $10.18–$10.21 — that combination would flag the advance losing thrust right at resistance.
④ RSI

PWH_rsi-90d-2026-08-02.svgThe July low carried a textbook bullish divergence: price made a lower low from $9.15 on June 2 to $8.43 on July 10, while RSI made a higher low — 40.7 at the first trough versus 44.0 at the second. Divergences are a possibility, not a verdict, but this one has already been validated by the follow-through: RSI has since climbed to 66.3 as price reclaimed every moving average. That said, a bottoming signal is not, by itself, bullish confirmation of unlimited upside — at 66.3 the oscillator is close to the 70 overbought threshold just as price meets the 52-week-high zone. In an emerging uptrend RSI can hold between 60 and 80 for extended stretches, so an overbought print alone is not a reversal call; the warning shape would be a bearish divergence, with price pushing above $10.21 while RSI posts a lower high.
⑤ Mansfield Relative Strength

PWH_rs-90d-2026-08-02.svgRelative strength versus the S&P/ASX 200 is the strongest single input on this chart. Mansfield RS stands at +12.8% — solidly in outperform territory — with a rising slope. The trajectory matters more than the level: a month ago the reading was −4.4%, meaning PWH has swung from market laggard to market leader within four weeks, and week-over-week it is still accelerating (+0.8 versus last week's +12.0). On the two-year chart, RS spent all of 2025 pinned deeply negative, crossed zero in late 2025, and has been mostly positive through 2026 — the current push is a re-acceleration within that longer improvement, not a first crossing. Sustained positive and rising RS is the backdrop in which breakouts have the best odds; a rollover back below zero would remove that premise.
⑥ ATR & ADX

PWH_atr_adx-90d-2026-08-02.svgATR(14) is $0.44, or 4.5% of price — a meaningful daily range that has ticked up during the July advance. This is the number that sizes the structural references: the 1×ATR level sits at $9.48 and the 2×ATR technical invalidation level at $9.04, both measured from Friday's close. ADX at 23.7 reads as an emerging trend — above the 20 line where directionality starts to register, but below the 25 threshold of an established trend. Remember that ADX measures strength, not direction; here it is rising alongside an advancing price, which is constructive. A push above 25 while price holds the breakout zone would upgrade this from "recovery leg" to "trend"; an ADX stall below 25 with price rejected at $10.21 would suggest the range is reasserting itself.
⑦ OBV

PWH_obv-90d-2026-08-02.svgThe two timeframes disagree here, and both readings are worth holding at once. On the 90-day window OBV is in accumulation: above its 20-day average with a rising slope and a +113.2% divergence reading — volume flow has confirmed the July price recovery emphatically. On the two-year window, however, OBV is only in early accumulation: above its MA20 but flat in slope, and the cumulative line remains deeply negative while price sits near two-year highs. That long-horizon lag is a bearish non-confirmation — the multi-month advance has not yet rebuilt the volume base that the 2024–2025 decline destroyed. It does not negate the short-term signal, but it does mean long-horizon conviction is still on probation, and in a stock this thinly traded the OBV line itself is noisier than usual. Watch whether the 2-year OBV can start posting higher highs alongside price.
Bull Case
- Fully bullish moving-average alignment: close $9.92 above rising SMA5 > SMA20 > SMA60.
- MACD golden cross (Jul 2) formed near the low, now above zero with a widening histogram.
- Bullish RSI divergence (Jun 2 → Jul 10) already validated by upside follow-through.
- Mansfield RS +12.8% vs the S&P/ASX 200, rising — swung from −4.4% a month ago and still accelerating.
- 90-day OBV in accumulation — above its MA20, rising, +113% divergence — flow confirms the advance.
- Price above both anchored VWAPs ($7.84 two-year, $8.75 90-day) — average holders are onside, limiting overhead supply pressure.
Bear Case
- Dense resistance cluster directly overhead: upper Bollinger Band $10.18 plus the 52-week high $10.21.
- Unfilled Aug 2024 gap at $10.66–$11.47 caps the next leg as a known supply zone.
- Two-year OBV deeply negative and flat while price nears two-year highs — long-horizon bearish non-confirmation.
- RSI 66.3 approaching overbought after a ~17.7% three-week run — extension risk into resistance.
- ADX 23.7 still below 25 — trend strength not yet established; this could remain range behaviour.
- Thin turnover (~197k shares/day average) — wider spreads, slippage risk, and volume/OBV signals less reliable.
Scenarios
| Scenario | Probability | Path | Trigger / Invalidation |
|---|---|---|---|
| Breakout continuation | ~40% | Consolidates a few sessions under $10.18–$10.21, then clears the zone and probes the unfilled gap at $10.66–$11.47. | Trigger: daily close above $10.21 on ≥1.5× volume. Invalidated by a close back below $9.57 after the attempt. |
| Pullback, higher base | ~35% | Rejection at the 52-week-high zone; retracement into the $9.57–$9.18 Fibonacci cluster (23.6–50%, where the SMA20 and Bollinger mid also sit); a higher low forms and the up-swing resumes. | Trigger: fade from $10.18–$10.21 on shrinking volume. Invalidated by a close below the 61.8% retracement at $9.00. |
| Failed advance | ~25% | Distribution near the highs; the 2-year OBV non-confirmation asserts itself; price breaks the retracement ladder and revisits $8.75 (78.6% / 90d aVWAP) and eventually $8.43. | Trigger: close below the 2×ATR technical invalidation level at $9.04 — that ends the current swing structure. |
Key Levels & Volatility References
| Level | Role | Basis |
|---|---|---|
| $10.21 | Resistance | 52-week high; last barrier before the unfilled $10.66–$11.47 gap zone |
| $10.18 | Resistance | Upper Bollinger Band (20, 2σ) |
| $9.92 | Current close | Swing high of the Jul 10 → Jul 31 up-leg (Fibonacci 0%) |
| $9.57 | Support | 23.6% retracement of the $8.43 → $9.92 up-swing |
| $9.35 | Support | 38.2% retracement of the same swing |
| $9.18 | Support | 50% retracement, converging with the SMA20 / Bollinger mid at $9.19 |
| $9.04 | Invalidation | 2×ATR technical invalidation level below the Jul 31 close |
What to Watch
- A daily close above $10.21 on at least 1.5× average volume — the confirmation that opens the unfilled gap window at $10.66–$11.47.
- Behaviour on any dip into $9.57–$9.18 — a higher low inside the Fibonacci cluster keeps the up-swing structure intact; losing $9.00 (61.8%) weakens it.
- Whether the two-year OBV starts printing higher highs — that would resolve the long-horizon non-confirmation flagged above.
- Mansfield RS holding above zero vs the S&P/ASX 200 — a rollover below zero removes the leadership premise behind the recovery.
- ADX pushing above 25 — upgrades the emerging trend to an established one.