Domino's Pizza Enterprises
This analysis is based on closing-price data as of November 20, 2026. Whether you're researching Domino's Pizza Enterprises (DMP) on the ASX or learning how to read stock charts, here are objective support, resistance and technical invalidation levels built from the RSI, MACD and ATR indicators.
Domino's Pizza Enterprises closed at $24.74 on November 20, 3.2% below its $25.55 52-week high (an intraday print on Nov 17) and 66.8% above its $14.83 52-week low. On the two-year chart the shares spent 2025 and the first half of 2026 in a long, volatile decline-and-base, and the November 2026 advance has carried them above the January 2026 peak for the first time. The SMA5 > SMA20 > SMA60 ordering re-formed on Nov 5 and MACD crossed above its signal the same day — both before the company's Nov 11 AGM — but the largest single step of the move, a +12.93% session on Nov 12, was the market's reaction to that AGM update. The current price level, and SMA5 with it, therefore rests substantially on one event-driven session, and this page treats that as the central caution alongside a bearish OBV divergence.
Snapshot as of November 20, 2026
| Item | Value | Reading |
|---|---|---|
| Close | $24.74 | −3.2% from 52w high · +66.8% from 52w low; just below the $25.13 Nov 16 close |
| 52-week range | $14.83 – $25.55 | Top of the range; the high was set intraday on Nov 17 |
| SMA 5 / 20 / 60 | $24.82 / $22.87 / $21.18 | SMA5 > SMA20 > SMA60 since Nov 5; the close sits fractionally below SMA5, whose level sits entirely above the Nov 12 gap |
| Bollinger (20) | $25.85 / $22.87 / $19.90 | Band width 26.03% — expanded sharply by the Nov 12 jump; close in the upper part of the band |
| aVWAP (2y anchor Jul 2, 2025) | $18.28 | Price well above the average anchored to the Jul 2, 2025 heavy-volume drop |
| aVWAP (90d anchor Aug 26, 2026) | $21.20 | Price above the average anchored to the Aug 26, 2026 session |
| RSI(14) | 66.3 | Firm, below 70 after a brief overbought reading on the Nov 12 jump; no RSI divergence flagged |
| Mansfield RS (vs the S&P/ASX 200) | +30.0% | Outperform, slope rising; +9.73 points on the week, +18.62 on the month |
| MACD (12,26,9) | 1.0026 / 0.8206 / +0.1819 | Above signal since the Nov 5 golden cross and above zero (two-year frame 1.0032 / 0.8216 / +0.1816) |
| ADX(14) | 30.0 | Strong-trend reading (29.7 on the two-year frame) |
| ATR(14) | $0.841 (3.4%) | Volatility lifted by the AGM sessions; 2×ATR spans about 6.8% of the share price |
| OBV (2y / 90d) | early distribution / early distribution | Below MA20 and flat on both frames; bearish OBV divergence flagged on both |
| Volume vs 20d avg | 0.874× | 440,574 shares against a 504,119 average — an ordinary final session |
| 1×ATR / 2×ATR technical invalidation | $23.90 / $23.06 | Volatility-based structural reference levels below the close |
① Price & Moving Averages
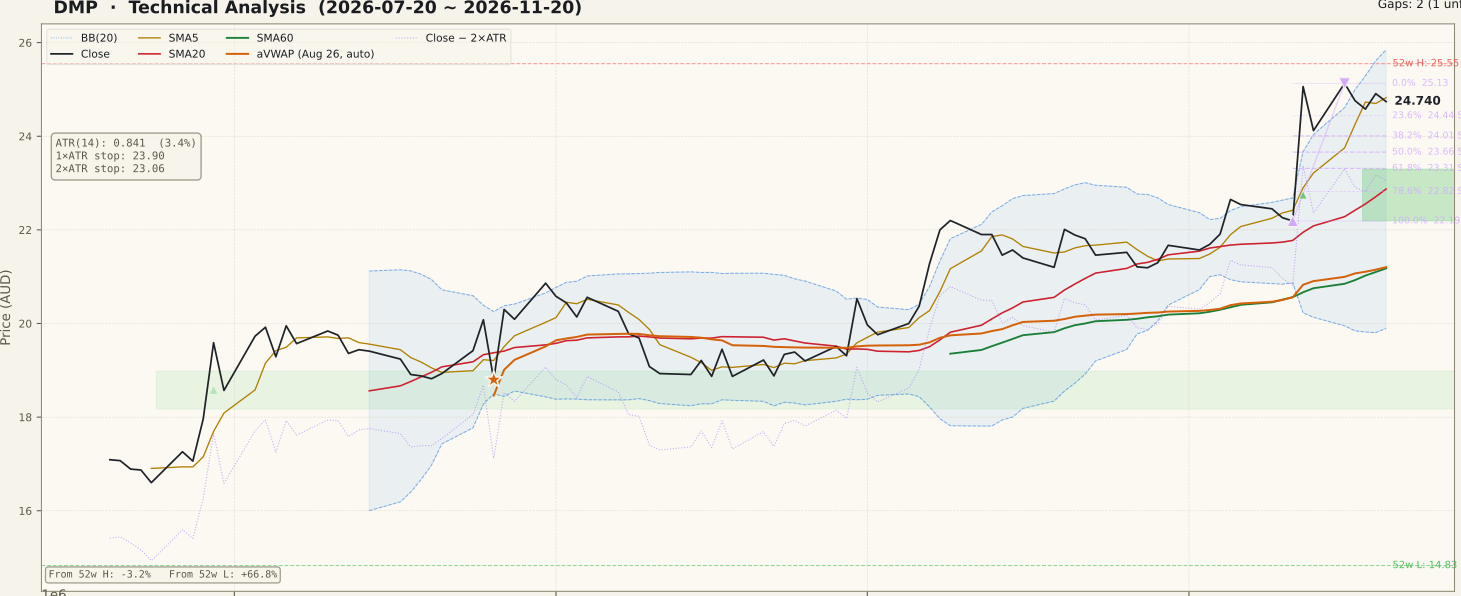
DMP_price-90d-2026-11-22.svgThe two-year frame is dominated by a decline from a $36.00 close in February 2025 to a $13.25 low in October 2025, punctuated by several heavy-volume sessions: Feb 7, 2025 (+21.3%), Jul 2, 2025 (−15.8% — the anchor of the two-year aVWAP at $18.28) and Aug 27, 2025 (−22.0%). A rebound into January 2026 peaked at a $24.35 close on Jan 23, then gave way again, with −11.1% on Feb 25 and −10.7% on Apr 28, 2026 and a basing phase near $15–$17 through mid-year. Since late July 2026 the shares have climbed in steps, and the November move took them above the January 2026 peak.
Event history, stated plainly: the company held its AGM on Nov 11, reporting easing sales declines, stronger free cash flow and lower net debt. Price was flat that day (−0.31%) on about 2.5× average volume, then jumped +12.93% on Nov 12 to $25.06 on about 3.7× volume. Nov 13 gave back 3.75%, Nov 16 added 4.19% to a $25.13 close (about 1.4×), and Nov 17–20 were quiet (−1.47%, −0.73%, +1.34%, −0.68%). That Nov 12 session left an unfilled gap between $22.19 and $23.30, and it is also the low anchor of the current Fibonacci swing.
Condition timing — the reason the setup is presented at all: the close has held above SMA20 since Oct 30, and the SMA5 > SMA20 > SMA60 ordering formed on Nov 5 (+3.38%, about 2.0× volume), four sessions before the AGM. It is a re-formation, not a first appearance — the same ordering formed on Jan 9, Jul 21, Aug 27 and Sep 30, 2026 and broke each time, most recently on Oct 29. New 20-session closing highs printed on Nov 5, Nov 12 and Nov 16. The alignment therefore preceded the AGM, but the current price level and the $24.82 SMA5 both sit above the Nov 12 reaction gap and depend on it; without that session the shares would be trading in the $22 area where they spent early November. The Fibonacci up-swing runs from $22.19 (Nov 11) to $25.13 (Nov 16): 23.6% is $24.44, 38.2% is $24.01, 50% is $23.66 and 61.8% is $23.31 — the deeper levels sit inside or just above the AGM gap.
② Volume

DMP_volume-90d-2026-11-22.svgThe tallest bar on the 90-day panel is Nov 12 (1,836,765 shares), with Nov 11 the second-largest of the month. The screened ASX universe's median volume ratio was about 0.80× on Nov 12, so the spike was specific to DMP rather than a market-wide day — consistent with the AGM as the driver. Earlier spikes belong to late July (Jul 30, +9.1%), late August (Aug 26–27) and mid-October.
The Nov 5 session that completed the moving-average ordering traded at about twice average volume on a +3.38% gain. In the last five sessions (Nov 16–20) volume ran from roughly 0.6× to 1.4× of average while the universe median ran 0.71–1.06×, so the post-AGM week was ordinary; the final session was 0.874×. The quiet consolidation near $24.6–$25.1 has not come on heavy declines, but it has not drawn fresh heavy participation either.
③ MACD

DMP_macd-90d-2026-11-22.svgThe MACD line is 1.0026 against a signal of 0.8206, a histogram of +0.1819. The golden cross came on Nov 5, from a position already above zero, after a dead cross in late October; the Nov 12 jump then pushed the line to its highest point on the 90-day panel. The histogram has narrowed slightly over the last few sessions as price moved sideways. Momentum is positive, but much of the recent lift in the MACD line is a mechanical result of the single Nov 12 session, so a cross back below the signal would be an early sign that the move is fading.
④ RSI

DMP_rsi-90d-2026-11-22.svgRSI(14) is 66.3 (66.3 on the two-year frame as well). It spent September in the mid-40s to 50s, rose toward 70 in mid-October, and briefly moved above 70 on the Nov 12 jump before settling back into the high 60s. No RSI divergence is flagged on either frame. The reading describes firm momentum that has cooled modestly during the sideways week rather than a stretched condition.
⑤ Mansfield Relative Strength

DMP_rs-90d-2026-11-22.svgMansfield RS vs the S&P/ASX 200 is +30.0%, above zero (outperform) with a rising slope. A week earlier it was +20.29 and a month earlier +11.40, so it gained 9.73 points on the week and 18.62 on the month — positive and accelerating on both measures. On the 90-day panel RS crossed above zero in early August and has stayed there, stepping up in October and again on Nov 12. On the two-year panel, it is the strongest relative reading of the whole window, after a long stretch deep below zero through 2025. The selection's RS rank of 99 reflects this, but part of the latest weekly jump is the AGM reaction, so the measure is not independent of the event.
⑥ ATR & ADX

DMP_atr_adx-90d-2026-11-22.svgATR(14) is $0.841, or 3.4% of price, which sets the 1×ATR reference at $23.90 and the 2×ATR technical invalidation level at $23.06, about 6.8% below the close. ATR had fallen to the lows of the 90-day window in early November and then jumped with the AGM sessions; it has eased over the last few days. ADX is 30.0 (29.7 on the two-year frame), above the 25 line that marks a strong trend, after hovering near 20 through October. ADX measures strength, not direction; with the rising averages it describes a trend that has only recently gained persistence. The $23.06 level sits just below the $23.30 top of the Nov 12 gap and the $23.31 Fibonacci 61.8% retracement.
⑦ OBV

DMP_obv-90d-2026-11-22.svgOBV is tagged early distribution on both the 90-day and two-year frames (below its MA20, flat). A bearish OBV divergence is flagged on both frames: price made its higher closing high of $25.13 on Nov 16 while OBV stayed below its earlier October peak. On the 90-day panel OBV drifted lower through September and October even as price rose, recovered only partly on the AGM volume, and has slipped again on the down days since. On the two-year panel OBV recovered strongly in late 2025 but has drifted sideways to lower through 2026.
The OBV-to-MA20 gap is −8.59% on the two-year frame and −12.85% on the 90-day frame. These figures measure distance from the moving average, not divergence. Taken together, volume flow has not confirmed the November price highs — a divergence is a possibility of weakening, not a confirmed top.
Bull Case vs Bear Case
Bull Case
- SMA5 > SMA20 > SMA60 since Nov 5 — formed before the Nov 11 AGM — with the close above SMA20 since Oct 30
- Mansfield RS +30.0%, accelerating on both the week (+9.73) and the month (+18.62)
- MACD above its signal since the Nov 5 golden cross and above zero
- ADX 30.0 — a strong-trend reading after a month near 20
- Price above both anchored VWAPs ($21.20 and $18.28) and above the January 2026 peak
- The post-AGM week held most of the gain on ordinary volume, with the Nov 12 gap ($22.19–$23.30) still open below
Bear Case
- The price level and SMA5 rest substantially on one AGM-reaction session (+12.93% on Nov 12)
- Bearish OBV divergence on both frames; OBV below MA20 (early distribution)
- The ordering has formed and broken four times earlier in 2026 — this is a re-formation
- The close is fractionally below SMA5 and below the $25.13 Nov 16 close
- The 2×ATR invalidation level ($23.06) is 6.8% below the close — a wide band
- The two-year chart shows repeated −10% to −22% sessions; the shares remain far below early-2025 levels
Scenarios
| Scenario | Probability | Path | Trigger / Invalidation |
|---|---|---|---|
| Consolidation above the AGM gap | 45% | Price ranges between the $24.01–$24.44 Fibonacci zone and $25.13–$25.55 while SMA20 rises toward price and the AGM bar ages out of the short averages | Trigger: further closes between $24.01 and $25.55. The structure remains intact while closes stay above $23.06 |
| Extension to new highs | 30% | Price clears the $25.13 Nov 16 close and the $25.55 52-week high, with the upper Bollinger Band ($25.85) next | Trigger: a close above $25.55 on above-average volume, ideally with OBV back above its MA20. Invalidation: a close back below $24.01 |
| Gap fill | 25% | The AGM gain unwinds into the $22.19–$23.30 gap toward SMA20 ($22.87), testing whether the pre-AGM ordering survives without the event | Trigger: a daily close below $23.06 (2×ATR technical invalidation) |
Key Levels & Volatility References
| Level | Role | Distance | Basis |
|---|---|---|---|
| $25.55 | Resistance | +3.3% | 52-week high (intraday, Nov 17) |
| $25.13 | Resistance | +1.6% | Nov 16 close — 0% of the Fibonacci swing |
| $24.74 | Current | — | Nov 20, 2026 close |
| $24.44 | Support | −1.2% | Fibonacci 23.6% retracement of the Nov 11 → Nov 16 swing |
| $23.90 | Support | −3.4% | 1×ATR reference; Fibonacci 38.2% ($24.01) just above |
| $23.30 | Support | −5.8% | Top of the unfilled Nov 12 gap ($22.19–$23.30); Fibonacci 61.8% ($23.31) |
| $23.06 | Invalidation | −6.8% | 2×ATR technical invalidation level; inside the Nov 12 gap |
What to Watch
- The $25.13–$25.55 zone. A close above the 52-week high on above-average volume would extend the move; repeated failures there would point to a range.
- The Nov 12 gap ($22.19–$23.30). A move into it would test whether the structure holds without the AGM-reaction session.
- OBV versus its MA20. A recovery above the average would ease the bearish divergence; further drift lower would strengthen it.
- SMA5 versus price. Every bar in the five-day average now trades above the AGM gap, and the close has slipped just under SMA5; whether price holds around it in the coming sessions is the cleaner read of post-event demand.
- The $23.06 level. A daily close below the 2×ATR technical invalidation level would undo the current structure.