Orora
This analysis is based on closing-price data as of November 20, 2026. Whether you're researching Orora (ORA) on the ASX or learning how to read stock charts, here are objective support, resistance and technical invalidation levels built from the RSI, MACD and ATR indicators.
Orora closed at $1.575 on November 20, 2026, still 35.2% below its $2.430 52-week high (February) after a two-year decline that included a −18.0% session on April 9. Since the October 14 swing low the shares have recovered: the close has held above SMA60 since October 20 and SMA5 > SMA20 > SMA60 has been in place since November 3. The past week is a shallow pullback from the $1.640 close of November 11 — price is now sitting right on SMA20 ($1.572), MACD crossed below its signal line on November 18, and volume rose on each of the down days. Mansfield RS versus the S&P/ASX 200 is still negative (−3.80%) but improving, so this reads as a recovering laggard testing its first support rather than a market leader.
Snapshot as of November 20, 2026
| Item | Value | Reading |
|---|---|---|
| Close | $1.575 | Unchanged on the day; −4.0% from the Nov 11 close of $1.640 · −35.2% from the 52w high · +29.9% from the 52w low |
| 52-week range | $1.2125 – $2.430 | Both are intraday prices: the high on Feb 12, 2026; the low on Jul 8, 2026 (a long lower wick — that session closed at $1.375) |
| SMA 5 / 20 / 60 | $1.595 / $1.572 / $1.471 | SMA5 > SMA20 > SMA60 since Nov 3; close below SMA5 and only 0.2% above SMA20 |
| Bollinger (20) | $1.661 / $1.572 / $1.482 | Band width 11.35%; close on the mid line |
| aVWAP (2y anchor Apr 9, 2026) | $1.430 | Price above the long-term average anchored to the Apr 9 −18.0% bar |
| aVWAP (90d anchor Aug 17, 2026) | $1.457 | Price above the short-term average anchored to the Aug 17 heavy-volume bar |
| RSI(14) | 56.8 | Above the midline, below overbought; no divergence flagged |
| Mansfield RS (vs the S&P/ASX 200) | −3.80% | Underperform but improving: +3.64 points on the week, +7.68 on the month (slope rising) |
| MACD (12,26,9) | 0.0373 / 0.0437 / −0.0064 | Dead cross on Nov 18, with both lines still above zero |
| ADX(14) | 36.6 | Strong trend reading (36.9 on the 90-day frame) |
| ATR(14) | $0.040 (2.56%) | Moderate volatility; 2×ATR spans 5.1% of the share price |
| OBV (2y / 90d) | early distribution / improving | 2y: just below a flat MA20 (−0.53%) · 90d: below a rising MA20; no OBV divergence on either frame |
| Volume vs 20d avg | 1.708× | 4,386,875 shares against a 2,568,500 average — the highest ratio of the week |
| 1×ATR / 2×ATR technical invalidation | $1.535 / $1.494 | Volatility-based structural reference levels below the close |
① Price & Moving Averages
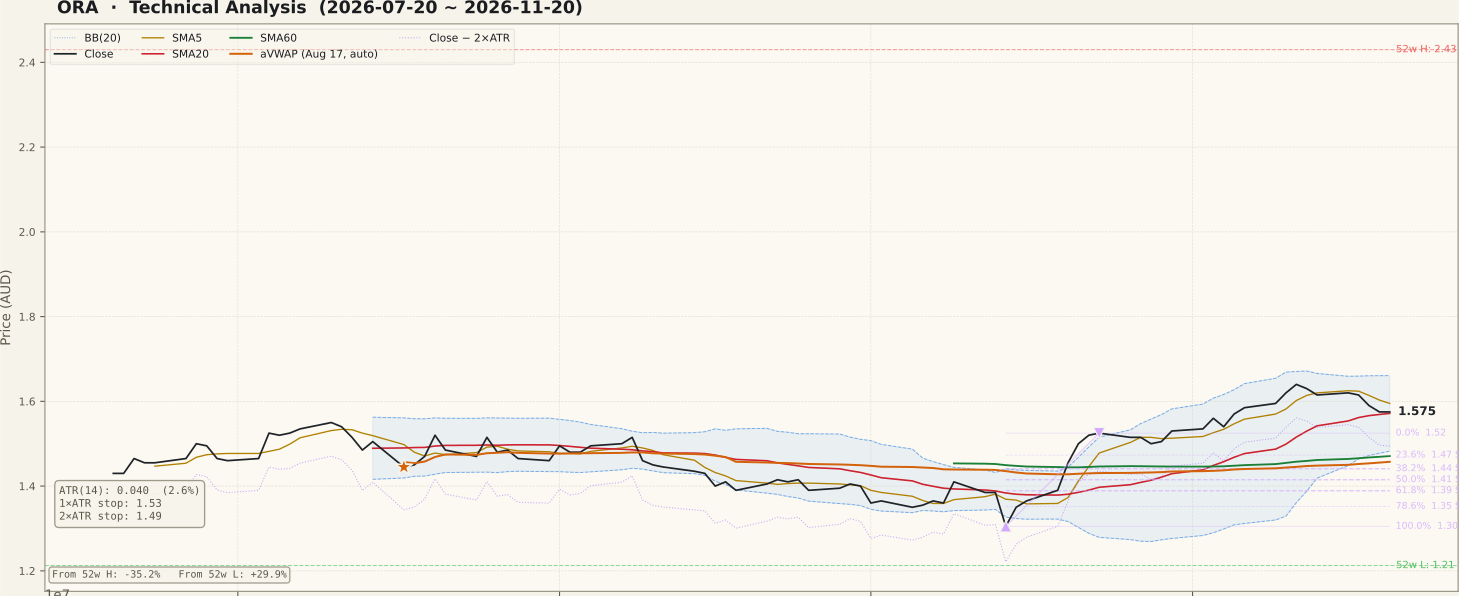
ORA_price-90d-2026-11-22.svgThe two-year frame opens near $2.42 in December 2024 and has drifted lower in steps: a 2025 range mostly between about $1.80 and $2.35 on a closing basis, a rebound to a $2.340 close in late February 2026, and then a sharp break. On April 9, 2026 the shares fell −18.0% from $1.975 to $1.620 on roughly 4.4× average volume, leaving an unfilled gap between $1.750 and $1.930 that still sits overhead as resistance. That bar anchors the two-year aVWAP ($1.430). The decline extended into May and June, with the lowest closes around $1.250 in early June; the 52-week low of $1.2125 is an intraday print on July 8, a session that recovered to close at $1.375.
The past five months have been a base-building phase. SMA5 > SMA20 > SMA60 formed in early July, again in mid-July and on September 7, but broke down on September 11, and price slid to an October 14 swing low close of $1.305. From there the shares rose for most of the following month: the close moved back above SMA60 on October 20, the moving-average ordering re-formed on November 3, and price reached $1.640 on November 11. The last week gave back about 4%, to $1.575, leaving the close on SMA20 ($1.572) and the Bollinger mid line.
On the two-year Fibonacci (the April 8 high of $1.975 to the April 14 low of $1.380, a down swing whose levels the data marks as resistance), the close sits between the 23.6% level ($1.520) and the 38.2% level ($1.607); the 50% ($1.678) and 61.8% ($1.748) levels sit above, the latter at the bottom edge of the April gap. The 90-day Fibonacci uses the October 14–23 up swing ($1.305 to $1.525); price has since moved beyond that swing's 0% end ($1.525, marked resistance in the data), and its 23.6% level ($1.473) lines up with SMA60 ($1.471) and the lower Bollinger Band ($1.482) as a support cluster.
② Volume

ORA_volume-90d-2026-11-22.svgThe heaviest sessions on the 90-day panel are the August 17 bar (10,932,262 shares, the 90-day aVWAP anchor) and the cluster around the October low, when volume ran at 4.9–8.0 million shares a day from October 14 to 19 as price turned up from $1.305. The early-November advance came on mostly below-average volume.
The pullback week looks different. Every session from November 16 to 20 traded above the 20-day average, and the ratio climbed to 1.708× on November 20 (4,386,875 shares against 2,568,500) while price slipped from $1.620 to $1.575. Across the screened ASX universe the median volume ratio was 0.71× to 1.06× over the same five sessions, so ORA's rise is above what the market as a whole was doing. Rising volume on falling prices is usually read as a caution, but there is a known source of ongoing volume here: Orora has an on-market share buyback in place (up to 10% of capital, February 2026 to February 2027, with daily notices to the ASX). The price data alone cannot show how much of this week's volume relates to it, so this page does not attribute the pattern to any one cause.
③ MACD

ORA_macd-90d-2026-11-22.svgMACD crossed below its signal line on November 18 and now reads 0.0373 against a signal of 0.0437, a histogram of −0.0064. Both lines remain above zero, which places this cross inside a positive momentum regime: it records the advance losing pace during the pullback rather than a shift into negative momentum. A cross from well above zero after a month-long advance is common in a consolidation; it would carry more weight if MACD itself fell back toward zero alongside a loss of SMA20.
④ RSI

ORA_rsi-90d-2026-11-22.svgRSI(14) is 56.8 — above the midline and well short of overbought, having cooled with the pullback. No RSI divergence is flagged on either frame, so there is no momentum warning of the type that often precedes a deeper reversal. The level to watch is the 50 area: a pullback that holds with RSI above it is consistent with a pause in an advance, while a move below it with price under SMA20 would suggest the October–November recovery is losing its footing.
⑤ Mansfield RS

ORA_rs-90d-2026-11-22.svgMansfield RS versus the S&P/ASX 200 is −3.80% (underperform), identical on both frames. A week ago it was −7.437% and a month ago −11.477%, so it has improved by 3.64 points on the week and 7.68 points on the month, and its slope is flagged "rising". That is a negative-but-improving reading: the stock has been closing the gap with the index, yet it is still below zero. A common misreading is to treat a rising RS line as outperformance; until the line crosses zero, ORA is still lagging the S&P/ASX 200 on this measure.
⑥ ATR · ADX

ORA_atr_adx-90d-2026-11-22.svgATR(14) is $0.040, or 2.56% of the share price — moderate volatility for a packaging company. That puts the 1×ATR reference at $1.535 and the 2×ATR technical invalidation level at $1.494, 5.1% below the close. ADX(14) reads 36.6 (36.9 on the 90-day frame), in the "strong" zone. ADX measures strength rather than direction; here it reflects the persistence of the October–November advance, and a strong ADX during a pullback is a lagging reading that tends to ease as price consolidates.
⑦ OBV

ORA_obv-90d-2026-11-22.svgThe two frames read differently. On the two-year count OBV is tagged "early distribution": just below a flat 20-day average (−0.53%), which reflects the long decline since 2025 more than this month's moves. On the 90-day count it is tagged "improving" — below its 20-day average but with that average rising. The 90-day gap to the average is printed as −766.86%, a figure inflated because the 90-day OBV average sits close to zero; it measures distance from OBV's own average, not a divergence, and is not a useful magnitude here. No OBV divergence is flagged on either frame. The above-average volume on this week's down days is the part of the volume picture to watch.
Bull Case vs Bear Case
Bull Case
- SMA5 > SMA20 > SMA60 since Nov 3, with the close above SMA60 since Oct 20
- Price is testing SMA20 ($1.572) from above after a shallow 4% pullback from $1.640
- Mansfield RS improving: +3.64 points on the week and +7.68 on the month, slope rising
- Price above both aVWAPs ($1.457 short-term and $1.430 long-term)
- RSI 56.8 with no divergence on either frame; MACD still above zero
- A support cluster below at $1.471–$1.482 (SMA60, 90-day Fibonacci 23.6% at $1.473, lower Bollinger Band)
Bear Case
- Volume rose through the pullback, reaching 1.708× on Nov 20, above the 0.71–1.06× market median
- MACD dead cross on Nov 18
- Mansfield RS still below zero (−3.80%) — ORA is still lagging the S&P/ASX 200
- Close below SMA5 ($1.595) and only 0.2% above SMA20
- Overhead resistance at the 2y Fibonacci 38.2% ($1.607) and 50% ($1.678) levels, with the Apr 9 gap ($1.750–$1.930) higher up
- OBV in "early distribution" on the two-year frame; the moving-average ordering failed once already (broke Sep 11)
Scenarios
| Scenario | Probability | Path | Trigger / Invalidation |
|---|---|---|---|
| Consolidation around SMA20 | 40% | Price ranges between SMA20 ($1.572) and the 38.2% level ($1.607) while MACD and volume settle | Trigger: closes holding above SMA20 as volume returns toward average. The structure stays intact while closes remain above $1.494 (2×ATR) |
| Deeper retracement | 35% | The rising-volume pullback continues through 1×ATR ($1.535) toward the $1.471–$1.482 cluster (SMA60, 90-day 23.6%, lower band) | Trigger: a close below SMA20 with RSI under 50. A close below $1.494 would move this into invalidation |
| Advance resumes | 25% | Price reclaims SMA5 and the 38.2% level ($1.607), retests the $1.640 Nov 11 close and approaches the 50% level ($1.678) | Trigger: a close above $1.640 with MACD turning back up and RS continuing toward zero. Invalidation: a close back below SMA20 |
Key Levels & Volatility References
| Level | Role | Distance | Basis |
|---|---|---|---|
| $1.678 | Resistance | +6.5% | 2y Fibonacci 50% (Apr 8–14 down swing); upper Bollinger Band ($1.661) just below |
| $1.640 | Resistance | +4.1% | Nov 11 close — the recent swing high |
| $1.607 | Resistance | +2.0% | 2y Fibonacci 38.2%; SMA5 ($1.595) just below |
| $1.575 | Current | — | Nov 20, 2026 close |
| $1.572 | Support | −0.2% | SMA20 / Bollinger mid line |
| $1.494 | Invalidation | −5.1% | 2×ATR technical invalidation level; 1×ATR reference at $1.535 above it |
| $1.473 | Support | −6.5% | 90-day Fibonacci 23.6%; SMA60 ($1.471) and lower Bollinger Band ($1.482) alongside |
What to Watch
- SMA20 at $1.572. The close is sitting on it; whether the next few closes stay above this line decides between consolidation and a deeper retracement.
- Volume on down days. This week's pullback came on rising, above-average volume; a return toward the 20-day average would ease that caution, while further heavy down days would reinforce it.
- Mansfield RS and the zero line. RS has improved for a month but is still at −3.80%; a cross above zero would mark the first outperformance versus the S&P/ASX 200 in this recovery.
- MACD after the Nov 18 cross. Holding above zero keeps this a cooling advance; a slide toward zero would weaken it.
- The $1.494 level. A daily close below the 2×ATR technical invalidation level would undo the current structure.