HMC Capital
This analysis is based on closing-price data as of November 20, 2026. Whether you're researching HMC Capital (HMC) on the ASX or learning how to read stock charts, here are objective support, resistance and technical invalidation levels built from the RSI, MACD and ATR indicators.
HMC Capital closed at $3.35 on November 20, 27.5% below its $4.62 52-week high of January 13, 2026 and 55.1% above the $2.16 low of March 30, 2026. The two-year chart is dominated by a long decline from around $12.50 in December 2024 to that March 2026 low, followed by an uneven base in the $2.60–$3.50 area. Within the base, a rebound from the $2.61 October 15 close carried price to $3.54 on November 16, and the week just ended was a pullback from that high, with SMA5 > SMA20 > SMA60 re-established on November 17 and Mansfield RS versus the S&P/ASX 200 positive at +10.8%. The caveats are a bearish RSI divergence on the November 16 high, a −4.01% basis-date session and a long-term chart that still sits well below its 2025 levels.
Snapshot as of November 20, 2026
| Item | Value | Reading |
|---|---|---|
| Close | $3.35 | −27.5% from 52w high · +55.1% from 52w low; −4.01% on the day, the lowest close since Nov 9 |
| 52-week range | $2.16 – $4.62 | Lower half of the range; high Jan 13, 2026 · low Mar 30, 2026 (intraday) |
| SMA 5 / 20 / 60 | $3.48 / $3.25 / $3.12 | SMA5 > SMA20 > SMA60 since Nov 17; close below SMA5 but above SMA20 and SMA60 |
| Bollinger (20) | $3.75 / $3.25 / $2.74 | Band width 31.2% — wide, reflecting the October–November swing; close in the upper half |
| aVWAP (2y anchor Jul 1, 2025) | $3.27 | Close only slightly above the long-term average anchored to the Jul 1, 2025 session |
| aVWAP (90d anchor Aug 26, 2026) | $3.14 | Close above the short-term average anchored to the Aug 26 high-volume session |
| RSI(14) | 56.0 | Bearish RSI divergence flagged: higher close on Nov 16 ($3.54) than Nov 5 ($3.42), with a lower RSI peak |
| Mansfield RS (vs the S&P/ASX 200) | +10.8% | Outperform, slope rising; +4.24 points on the week, +24.37 on the month |
| MACD (12,26,9) | 0.1382 / 0.1250 / +0.0132 | Golden cross on Oct 27, above zero; histogram positive but thin |
| ADX(14) | 35.4 | Strong-trend reading (35.7 on the 90-day frame) |
| ATR(14) | $0.151 (4.5%) | High volatility relative to price; 2×ATR spans about 9.0% of the share price |
| OBV (2y / 90d) | early accumulation / accumulation | Above MA20 on both frames; flat on 2y, rising on 90d; no OBV divergence flagged |
| Volume vs 20d avg | 0.714× | 851,043 shares against a 1,192,013 average on the −4.01% session |
| 1×ATR / 2×ATR technical invalidation | $3.20 / $3.05 | Volatility-based structural reference levels below the close |
① Price & Moving Averages
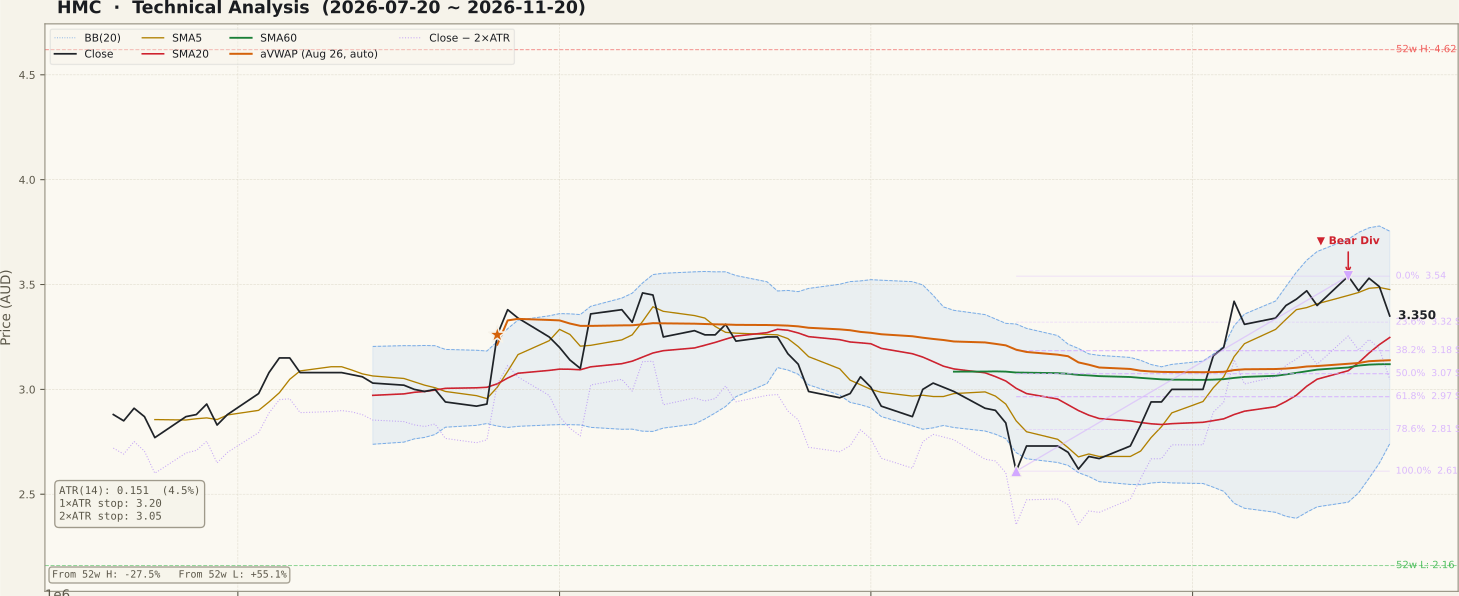
HMC_price-90d-2026-11-22.svgThe two-year frame opens near $12.50 in December 2024 and falls through most of 2025: below $6.50 by March, under $5 in April, and a −17.3% session on Jul 1, 2025 on about 5× average volume that now anchors the two-year aVWAP ($3.27). A recovery to the $4.62 52-week high on Jan 13, 2026 did not last; February and March took price back to the $2.16 low of Mar 30, 2026. Since then the stock has built a base, with large single-session rises on Apr 1 (+16.2%) and May 6 (+17.1%) and a third on Aug 26 (+11.3% on about 6.3× volume) that anchors the 90-day aVWAP ($3.14). All of these are history well outside the most recent five sessions.
On the 90-day chart the August advance faded through September and the SMA5 > SMA20 > SMA60 ordering broke on Sep 21. Price slid to a $2.61 close on Oct 15, then turned: MACD crossed up on Oct 27, the close moved above SMA60 on Nov 3, and a run of higher closes reached $3.54 on Nov 16. The moving averages re-ordered bullishly on Nov 17 — the fourth time that ordering has formed in the past year (earlier runs from Jul 1, Aug 12 and Aug 27) — so it has repeatedly appeared and broken inside this base rather than marking a lasting trend.
The week itself alternated: +4.12% on Nov 16, −1.98%, +1.73% on the Nov 18 AGM day (no change to guidance identified), −1.13%, then −4.01% on Nov 20 to $3.35, below SMA5 ($3.48) but above SMA20 ($3.25). The Fibonacci swing runs from the $2.61 Oct 15 low to the $3.54 Nov 16 high: the 23.6% retracement at $3.32 sits just under the close, 38.2% is $3.18 and 50% is $3.07. Seven gaps appear on the two-year chart and none is unfilled.
② Volume

HMC_volume-90d-2026-11-22.svgThe tallest bars on the 90-day panel are Aug 26 and Aug 27, the sessions that lifted price toward $3.38, and a cluster of heavier sessions around the October decline. The rebound from mid-October came on mixed volume, with the Nov 5 +6.88% session the main spike of that leg.
In the past week the up sessions were the heavier ones — Nov 16 at about 1.76× the 20-day average and the Nov 18 AGM session above average — while the down sessions were lighter. The basis-date −4.01% session traded 851,043 shares, 0.714× the 20-day average of 1,192,013. Market-wide volume across the ASX universe was in a normal 0.71–1.06× range over Nov 16–20, so these ratios are not distorted by an index event. A pullback on below-average volume is less concerning than one on heavy volume, but one session does not settle it.
③ MACD

HMC_macd-90d-2026-11-22.svgMACD crossed above its signal line on Oct 27, below zero at the time, and has since moved into positive territory: MACD is 0.1382 against a signal of 0.1250, leaving a histogram of +0.0132. The cross came early in the rebound from the October low, which is the more constructive kind. The thin histogram is the caveat — after the Nov 20 drop the gap between the lines has narrowed, and a further down session or two could produce a cross back down. Holding the histogram above zero through the pullback is what keeps the momentum reading intact.
④ RSI

HMC_rsi-90d-2026-11-22.svgRSI(14) dropped toward the oversold zone around the Oct 15 low, then climbed above 70 in early November before easing to 56.0 on Nov 20 — mid-range, neither stretched nor weak. A bearish RSI divergence is flagged on both frames: the first peak is the Nov 5 close at $3.42 with RSI at 73.0, and the second is the Nov 16 close at $3.54, a higher price high reached on a lower RSI peak. That says the push to $3.54 had less momentum behind it than the early-November leg. A divergence is a possibility of a top, not confirmation of one; closes back below SMA20 would be the follow-through that gives it weight.
⑤ Mansfield RS

HMC_rs-90d-2026-11-22.svgMansfield RS versus the S&P/ASX 200 is +10.8%, above zero on both frames (outperform, slope rising). A week ago it was 6.54%, so the weekly change is +4.24 points; a month ago it was −13.59%, so the monthly change is +24.37 points — it has moved from below zero to above it over the past month and is still accelerating. The longer view tempers this: through much of the two-year window HMC trailed the index by a wide margin during the 2025 decline, so the current reading marks a recent turn in relative performance rather than a long record of leadership.
⑥ ATR · ADX

HMC_atr_adx-90d-2026-11-22.svgATR(14) is $0.151, or 4.5% of the share price — a volatile stock for its price level, which is why the reference levels sit relatively far from the close. The 1×ATR reference is $3.20 and the 2×ATR technical invalidation level is $3.05, about 9.0% below the close. ADX(14) is 35.4 on the two-year frame and 35.7 on the 90-day frame, a strong-trend value built during the October–November rebound. ADX measures strength, not direction: it says the recent move has been forceful, and a falling ADX through this pullback would show that force fading.
⑦ OBV

HMC_obv-90d-2026-11-22.svgOBV is above its 20-day average on both frames, but the two read differently. On the two-year frame the state is "early accumulation" with a flat slope, 4.84% above MA20 — OBV is still deeply negative over that window after the long 2025 decline. On the 90-day frame the state is "accumulation" with a rising slope; its 178.68% figure is the gap to its own MA20, which sits close to zero, so the percentage is inflated and is not a divergence measure. No OBV divergence is flagged on either frame, which contrasts with the RSI divergence: the volume balance has not weakened the way momentum has.
Bull Case vs Bear Case
Bull Case
- SMA5 > SMA20 > SMA60 re-established Nov 17, with the close above SMA60 since Nov 3
- Mansfield RS +10.8% versus the S&P/ASX 200, +4.24 on the week and +24.37 on the month
- MACD golden cross on Oct 27, now above zero
- OBV above MA20 on both frames and rising on 90 days, with no OBV divergence
- ADX 35.4 — the rebound from the Oct 15 low has had real directional force
- The Nov 20 pullback came on 0.714× average volume, while the week's up sessions were heavier
Bear Case
- Bearish RSI divergence: higher close on Nov 16 ($3.54) than Nov 5 ($3.42) on a lower RSI peak
- −4.01% on Nov 20 put the close below SMA5 ($3.48)
- MACD histogram only +0.0132 — a cross back down would not take much
- The bullish moving-average order has formed and broken several times in the past year
- Price is 27.5% under the 52-week high and only slightly above the 2y aVWAP ($3.27)
- ATR at 4.5% of price — wide daily swings make the structure easy to shake
Scenarios
| Scenario | Probability | Path | Trigger / Invalidation |
|---|---|---|---|
| Pullback steadies above SMA20 | 45% | Price finds support between the $3.32 23.6% retracement and SMA20 ($3.25), RSI resets toward 50 and MACD stays above its signal | Trigger: closes back above SMA5 ($3.48). The structure remains while closes stay above the $3.05 2×ATR level |
| Rebound extends | 25% | Price clears the $3.54 Nov 16 high and moves toward the upper Bollinger Band ($3.75), with the divergence left unconfirmed | Trigger: a close above $3.54 on above-average volume. Invalidation: a close back below SMA20 |
| Divergence plays out | 30% | The RSI divergence is followed by closes below SMA20 and the 38.2% retracement ($3.18), with the 90-day aVWAP ($3.14) and SMA60 ($3.12) next | Trigger: a daily close below $3.05 (2×ATR technical invalidation) |
Key Levels & Volatility References
| Level | Role | Distance | Basis |
|---|---|---|---|
| $3.54 | Resistance | +5.7% | Nov 16 close — swing high of the Fibonacci (0% of the swing) |
| $3.48 | Resistance | +3.8% | SMA5, now above the close |
| $3.35 | Current | — | Nov 20, 2026 close |
| $3.32 | Support | −0.9% | 23.6% retracement of the Oct 15–Nov 16 swing |
| $3.25 | Support | −3.1% | SMA20 / Bollinger mid line; 2y aVWAP ($3.27) just above |
| $3.18 | Support | −4.9% | 38.2% retracement; 1×ATR ($3.20) just above, 90d aVWAP ($3.14) and SMA60 ($3.12) just below |
| $3.05 | Invalidation | −9.0% | 2×ATR technical invalidation level; 50% retracement ($3.07) alongside |
What to Watch
- SMA20 at $3.25. Closes holding above it would keep this a pullback inside the rebound; closes below it would be the first follow-through on the RSI divergence.
- The $3.54 Nov 16 high. A close above it on above-average volume would extend the rebound and leave the divergence unconfirmed.
- The MACD histogram. At +0.0132 it is thin — staying positive through the pullback keeps the Oct 27 cross intact, a re-cross down would cancel it.
- Volume on down sessions. Further declines on below-average volume read as a pause; declines on heavy volume would change that reading.
- The $3.05 level. A daily close below the 2×ATR technical invalidation level would undo the current structure.