Cochlear
This analysis is based on closing-price data as of November 20, 2026. Whether you're researching Cochlear (COH) on the ASX or learning how to read stock charts, here are objective support, resistance and technical invalidation levels built from the RSI, MACD and ATR indicators.
Cochlear closed at $149.99 on November 20, 47.3% below its $284.88 52-week high and 69.0% above its $88.74 52-week low. The two-year chart is still shaped by the 2026 declines — an −18.9% gap on Feb 13 and a −40.7% session on Apr 22 — and by a stepwise recovery since late April. In the short term the moving averages remain stacked upward (SMA5 > SMA20 > SMA60 since Nov 4) and the shares are pulling back toward that structure, but the picture has softened: MACD crossed below its signal line on Nov 20 and a bearish RSI divergence is flagged. Mansfield RS has improved to −6.5% versus the S&P/ASX 200, still below zero.
Snapshot as of November 20, 2026
| Item | Value | Reading |
|---|---|---|
| Close | $149.99 | −47.3% from 52w high · +69.0% from 52w low; 3.5% below the $155.47 Nov 6 close, the high of the current swing |
| 52-week range | $88.74 – $284.88 | Lower half of the range after the February–April 2026 decline |
| SMA 5 / 20 / 60 | $152.08 / $148.12 / $140.13 | SMA5 > SMA20 > SMA60 since Nov 4; the close slipped under SMA5 on Nov 20 but holds above SMA20 and SMA60 |
| Bollinger (20) | $159.46 / $148.12 / $136.77 | Band width 15.32%; close just above the middle band |
| aVWAP (2y anchor Apr 22, 2026) | $120.06 | Price 24.9% above the average anchored to the −40.7% session |
| aVWAP (90d anchor Aug 31, 2026) | $137.48 | Price 9.1% above the average anchored to the Aug 31 heavy-volume session |
| RSI(14) | 56.2 | Above 50 but off its highs; bearish RSI divergence flagged (Oct 23 → Nov 19) |
| Mansfield RS (vs the S&P/ASX 200) | −6.5% | Underperform, slope rising; +5.59 points on the week, +9.63 on the month |
| MACD (12,26,9) | 3.8548 / 4.0114 / −0.1566 | Crossed below the signal line on Nov 20, still above zero (two-year frame 3.8554 / 4.0122 / −0.1568) |
| ADX(14) | 38.5 | Strong-trend reading (38.1 on the two-year frame) |
| ATR(14) | $4.31 (2.9%) | 2×ATR spans about 5.7% of the share price |
| OBV (2y / 90d) | early accumulation / accumulation | Above MA20 on both frames (flat on 2y, rising on 90d); bullish OBV divergence flagged (Nov 11 → Nov 20) |
| Volume vs 20d avg | 0.672× | 225,769 shares against a 336,010 average — the −2.52% final session came on light volume |
| 1×ATR / 2×ATR technical invalidation | $145.68 / $141.38 | Volatility-based structural reference levels below the close (same values on the two-year frame) |
① Price & Moving Averages
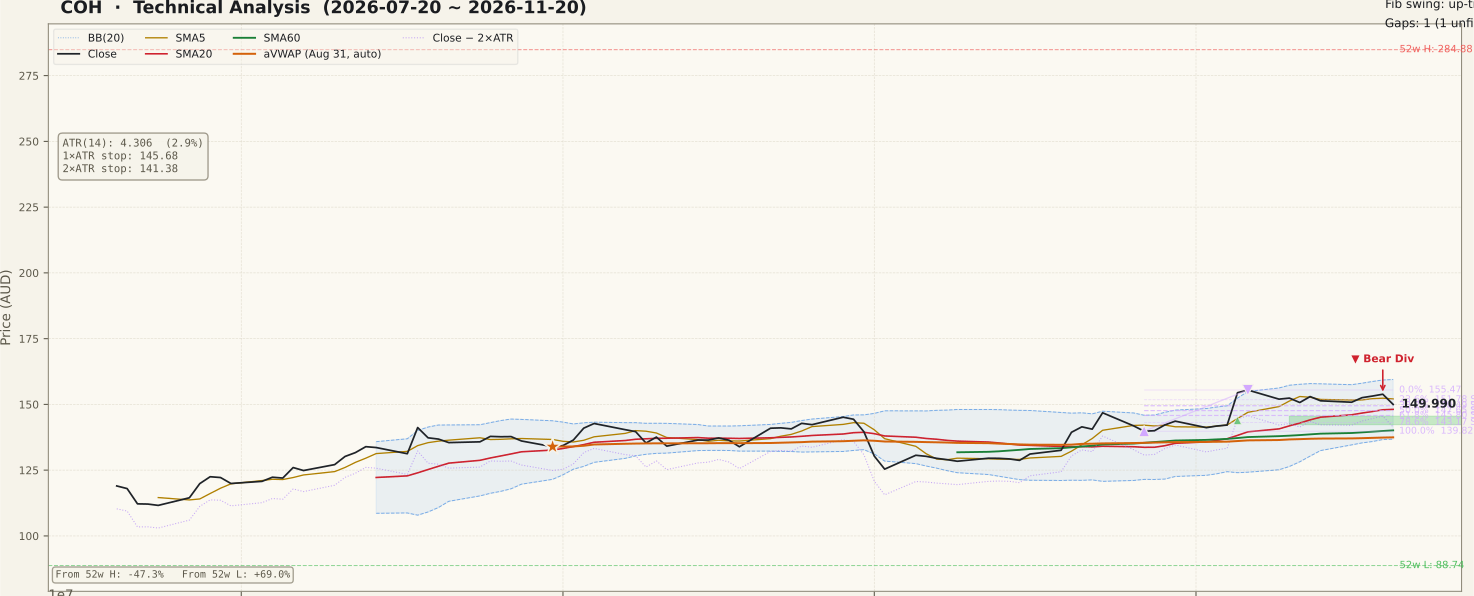
COH_price-90d-2026-11-22.svgThe two-year frame is dominated by the 2026 breakdown. On Feb 13 the shares gapped down −18.9%, leaving an unfilled gap from $221.67 to $242.93 overhead, and on Apr 22 they fell −40.7% in a single session, from $167.94 to $99.58, on about 9.4× average volume. That bar anchors the two-year aVWAP ($120.06) and left a second unfilled gap from $114.95 to $166.51; price is now trading inside it, with the $166.51 upper edge still overhead. These events sit well outside the recent window and are background to the current reading, not part of it.
Since the late-April low the recovery has come in steps. The close moved back above SMA20 and SMA60 on Oct 20, and both conditions have held since. The SMA5 > SMA20 > SMA60 ordering — this pullback setup's backdrop — formed on Nov 4 and is still in place; it is the fourth formation in the past year (after Jul 3, Aug 3 and Sep 22), and the Sep 22 run ended on Oct 2. On Nov 5 the shares rose +8.65% to $154.44 on roughly average volume (about 0.93×) while healthcare peers gained about +2.6% to +3.5%; no company-specific catalyst was identified. That session left an unfilled gap from $142.25 to $145.57 below price.
Price then held a $150–$155 band. The last five sessions were quiet — −0.36%, +1.15%, +0.40%, +0.46% — until Nov 20 fell −2.52% to $149.99 (intraday low $147.63), closing below SMA5 ($152.08) but above SMA20 ($148.12). The 90-day Fibonacci swing runs from $139.82 (Oct 27) to $155.47 (Nov 6): the close sits just above the 38.2% retracement ($149.49), with 50% at $147.65 and 61.8% at $145.80. The 23.6% level ($151.78) is labelled support in the data, but the close is now below it, so it currently acts as a minor overhead level. The two-year Fibonacci set (a Jul 24 → Aug 18, 2026 swing, $111.61 to $141.20) lies entirely below the current price.
② Volume

COH_volume-90d-2026-11-22.svgThe Aug 31 bar remains the outlier on the 90-day panel — about 9.7 million shares on a down close, far larger than any other session and the anchor of the 90-day aVWAP. Outside it, volume has mostly run near or below the 20-day average, and the late-October to November advance was not built on heavy participation.
The past week was light. The Nov 20 decline of −2.52% traded 225,769 shares, 0.672× the 20-day average of 336,010. A pullback on below-average volume reads as a lack of urgency rather than heavy distribution. The screened ASX universe's median volume ratio ran about 0.71–1.06× over Nov 16–20, a normal range, so the quiet tape reflects this stock rather than a market-wide distortion.
③ MACD

COH_macd-90d-2026-11-22.svgMACD crossed below its signal line on Nov 20. The line is 3.8548 against a signal of 4.0114, a histogram of −0.1566. The MACD-above-signal run lasted from the Oct 20 golden cross to Nov 19; through mid-November the histogram bars had been shrinking as the signal line caught up, and the Nov 20 decline tipped it negative. The cross happened well above zero, which typically marks a cooling of momentum within an advance rather than a reversal of the larger structure. It is still a weakening signal: the short-term impulse that carried price from $139.82 to $155.47 has faded.
④ RSI

COH_rsi-90d-2026-11-22.svgRSI(14) is 56.2 on both frames, down from the mid-60s earlier in the week after the Nov 20 decline. A bearish RSI divergence is flagged on both frames: price made a higher high, from $146.81 on Oct 23 to $153.87 on Nov 19, while RSI made a lower high. The divergence is a caution about momentum behind the latest push, not a confirmed top — it needs follow-through such as a close below SMA20 to carry weight. RSI remains above 50, and on the two-year panel it sits far from the sub-30 stretches of the February and April declines.
⑤ Mansfield Relative Strength

COH_rs-90d-2026-11-22.svgMansfield RS vs the S&P/ASX 200 is −6.5%, below zero (underperform) with a rising slope. A week ago it was −12.06, so it improved by 5.59 points over the week; a month ago it was −16.10, an improvement of 9.63 points. Both readings are negative-improving: the stock is closing the gap with the index without yet outperforming it. On the 90-day panel RS has climbed from about −45 in July to its highest level of the window. The direction is constructive, but a below-zero RS remains a caution while the stock is still lagging the benchmark.
⑥ ATR & ADX

COH_atr_adx-90d-2026-11-22.svgATR(14) is $4.31, or 2.9% of price. That sets the 1×ATR reference at $145.68 and the 2×ATR technical invalidation level at $141.38, 5.7% below the close. The invalidation level now sits below the bottom of the Nov 5 gap ($142.25), close to the $141.20 Aug 18 high that anchors the two-year Fibonacci set and above SMA60 ($140.13). ATR spiked after the Nov 5 jump, eased through mid-November and ticked up with the Nov 20 range. ADX is 38.5 (38.1 on the two-year frame), above the 25 line for a strong trend and still edging higher. ADX measures strength, not direction; with the moving averages stacked upward it describes a firm short-term advance inside a much larger two-year decline.
⑦ OBV

COH_obv-90d-2026-11-22.svgOBV is tagged early accumulation on the two-year frame (above MA20, flat) and accumulation on the 90-day frame (above MA20, rising). A bullish OBV divergence is flagged on both frames: price made a lower low, from $150.72 on Nov 11 to $149.99 on Nov 20, while OBV made a higher low — less down-day volume flowed out on the latest dip than on the one before. This is the opposite direction to the RSI reading, and the two are stated separately: momentum has cooled while cumulative volume has held up. Neither is a confirmed signal on its own.
Context: the Aug 31 bar — about 9.7 million shares on a down close — cut OBV by that amount in a single step, the cliff visible on both panels, so OBV's depressed absolute level traces largely to that one session. The OBV-to-MA20 gap is +7.88% on the two-year frame and +7.71% on the 90-day frame; these figures measure distance from the moving average, not divergence.
Bull Case vs Bear Case
Bull Case
- SMA5 > SMA20 > SMA60 since Nov 4, and the close has held above SMA20 and SMA60 since Oct 20
- The Nov 20 decline came on light volume (0.672×), with the close holding the Fibonacci 38.2% level ($149.49)
- Mansfield RS up 5.59 points on the week and 9.63 on the month, to −6.5%
- Bullish OBV divergence flagged (Nov 11 → Nov 20); OBV above its MA20 on both frames
- ADX 38.5 — a strong-trend reading, still edging higher
- Price above both anchored VWAPs ($137.48 and $120.06); unfilled Nov 5 gap ($142.25–$145.57) sits below as support
Bear Case
- MACD crossed below its signal line on Nov 20 — the Oct 20 momentum run has ended
- Bearish RSI divergence flagged (Oct 23 → Nov 19) — price higher high, RSI lower high
- Mansfield RS still below zero — the stock continues to lag the S&P/ASX 200
- The Nov 5 +8.65% jump came on roughly average volume with no company-specific catalyst identified
- This is the fourth formation of the moving-average ordering in a year; the earlier three did not lead to a sustained trend
- Price trades inside the large unfilled April gap ($114.95–$166.51), 47.3% below the 52-week high
Scenarios
| Scenario | Probability | Path | Trigger / Invalidation |
|---|---|---|---|
| Pullback holds, advance resumes | 25% | Price steadies above SMA20, MACD turns back up, and the shares retest the $155.47 Nov 6 high | Trigger: a close above $155.47 on above-average volume. Invalidation: a close below SMA20 ($148.12) |
| Range between gap and high | 45% | Price ranges between the Nov 5 gap top ($145.57) and $155.47 while momentum resets and the opposing RSI and OBV divergences resolve | Trigger: further closes inside $145.57–$155.47. The structure remains intact while closes stay above the $141.38 2×ATR level |
| Gap fill and deeper pullback | 30% | The MACD cross and RSI divergence play out: price fills the Nov 5 gap and slips toward SMA60 ($140.13) and the 90d aVWAP ($137.48) | Trigger: a daily close below $141.38 (2×ATR technical invalidation) |
Key Levels & Volatility References
| Level | Role | Distance | Basis |
|---|---|---|---|
| $159.46 | Resistance | +6.3% | Upper Bollinger Band |
| $155.47 | Resistance | +3.7% | Nov 6 close — 0% of the 90-day Fibonacci swing; SMA5 ($152.08) and the 23.6% level ($151.78) sit just above the close |
| $149.99 | Current | — | Nov 20, 2026 close |
| $149.49 | Support | −0.3% | Fibonacci 38.2% retracement of the Oct 27 → Nov 6 swing |
| $148.12 | Support | −1.2% | SMA20 and Bollinger middle band; Fibonacci 50% ($147.65) alongside |
| $145.68 | Support | −2.9% | 1×ATR reference; Fibonacci 61.8% ($145.80) and the top of the unfilled Nov 5 gap ($145.57) alongside |
| $141.38 | Invalidation | −5.7% | 2×ATR technical invalidation level; Nov 5 gap bottom ($142.25) just above, SMA60 ($140.13) just below |
What to Watch
- SMA20 at $148.12. The close has held above it since Oct 20; a close below it is where the MACD cross and the RSI divergence gain confirmation.
- MACD after the Nov 20 cross. A quick recross above the signal line would mark a pause; a widening negative histogram would point to a deeper pullback.
- The opposing divergences. RSI (bearish) and OBV (bullish) point in different directions; whichever side price confirms next is the more informative signal.
- Mansfield RS and the zero line. RS has improved for a month; a move above zero would show the stock outperforming the S&P/ASX 200 for the first time since the April drop.
- The $141.38 level. A daily close below the 2×ATR technical invalidation level, after filling the Nov 5 gap, would undo the current structure.