Metcash
This analysis is based on closing-price data as of November 20, 2026. Whether you're researching Metcash (MTS) on the ASX or learning how to read stock charts, here are objective support, resistance and technical invalidation levels built from the RSI, MACD and ATR indicators.
On the two-year chart Metcash is still working its way back from a long decline: the stock gapped sharply lower on December 1, 2025, bottomed at the 52-week low of $2.63 in May 2026, and spent the middle of the year moving sideways below $3.25. Since early October the structure has turned constructive — the close has held above the 20-day average since October 2 and above the 60-day since October 6, and the short-term stack (SMA5 > SMA20 > SMA60) has been in place since October 21. Relative strength against the S&P/ASX 200 has moved firmly positive. The near-term caveat is fresh: on Friday's close (November 20) the MACD line crossed below its signal line and the price slipped 1.46%, so momentum is cooling right at the November 12 swing high of $3.45.
Snapshot as of Nov 20 close
| Item | Value | Read |
|---|---|---|
| Close | $3.38 | −1.46% on the day; −12.4% from 52w high, +28.5% from 52w low |
| 52-week high / low | $3.86 / $2.63 | High sits just before the Dec 2025 gap; low from May 2026 |
| SMA 5 / 20 / 60 | $3.42 / $3.32 / $3.08 | Bullish stack since Oct 21; close below SMA5, above SMA20 |
| Bollinger (20, 2) | $3.53 / $3.32 / $3.12 | Band width 12.38%; price back near the middle band |
| aVWAP 90d (anchor Sep 9, 2026) | $3.10 | Price above — short-term anchor in profit |
| aVWAP 2y (anchor Dec 1, 2025) | $3.08 | Price above the post-gap anchor |
| RSI (14) | 64.1 | Back below 70 after an overbought stretch; no divergence flagged |
| Mansfield RS vs the S&P/ASX 200 | +11.56% | Outperforming, rising; +5.45 pts on the week, +9.97 pts on the month |
| MACD (12, 26, 9) | 0.0886 / 0.0920 / −0.0033 | Dead cross on Nov 20, well above zero |
| ADX (14) | 57.4 (2y) / 58.0 (90d) | Strong trend reading |
| ATR (14) | $0.0596 (1.76%) | Low day-to-day volatility |
| OBV | 2y: early accumulation, flat · 90d: accumulation, rising | OBV above its MA20 on both timeframes |
| Volume (Vol/Avg) | 0.99x | Friday's decline came on average volume |
| 1× / 2× ATR technical invalidation | $3.32 / $3.26 | Volatility references below the close |
① Price & Moving Averages
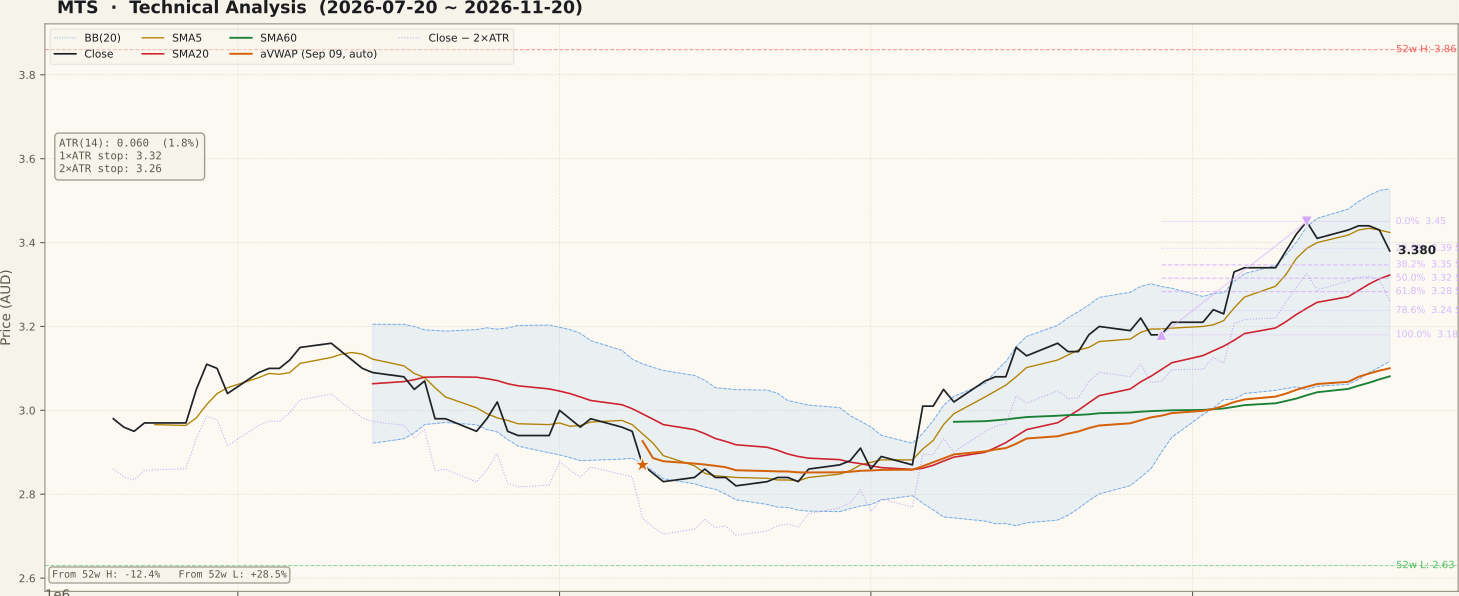
The 90-day picture is a steady climb from the early-October base near $2.86 to a swing high of $3.45 on November 12, with the 5-, 20- and 60-day averages fanning out in order beneath the price. SMA20 at $3.32 and SMA60 at $3.08 are both rising, and the 2y aVWAP from the December 2025 gap ($3.08) and the 90d aVWAP from September 9 ($3.10) sit together with SMA60 — a cluster of reference levels some 9% below the close.
The 90-day Fibonacci swing runs from $3.18 (Oct 29) to $3.45 (Nov 12). Friday's close of $3.38 sits fractionally below the 23.6% level ($3.39, labelled support in the data), so the first retracement level has already been touched; the 38.2% ($3.35) and 50% ($3.32, alongside SMA20) levels are the next references. The longer two-year swing ($2.86 on Oct 1 to $3.22 on Oct 27) now lies entirely below the price — its levels between $3.22 and $2.86 are deeper background references rather than near-term ones.
Overhead, the unfilled gap from December 1, 2025 spans $3.52–$3.67, and the upper Bollinger Band is at $3.53. That gap is the most obvious structural resistance on the two-year chart: the stock has not traded in that zone since the gap opened.
② Volume

Friday's volume ratio is 0.99x — Friday's −1.46% decline came on ordinary participation rather than a heavy volume surge. The busiest session of the past week was November 17 (about 6.2 million shares) on a small up-close, and the October push off the base came with a run of above-average green bars.
The last five sessions contain no outsized price or volume event. On the two-year panel the most visible spike is a single session in March 2026 with very large volume but almost no price change, coinciding with the quarterly index rebalance — a historical feature of the chart, not a driver of the current trend.
③ MACD

The MACD line (0.0886) crossed below its signal line (0.0920) on November 20, leaving a small negative histogram of −0.0033. That ends a bullish MACD run that had been in place since September 25. The histogram had already been shrinking through November as the price rise slowed.
The cross happened far above the zero line, which usually signals momentum cooling inside an uptrend rather than a trend reversal on its own. Whether this becomes a pause or the start of a deeper pullback depends on what price does at the $3.32–$3.35 support cluster.
④ RSI

RSI(14) is 64.1. It spent much of November above 70 and has now dropped back below that line, consistent with the MACD signal that upside momentum is fading. A reading in the 60s is still in bullish territory, and no RSI divergence is flagged in the data on either timeframe.
The October move began from near-oversold readings in late September, so this RSI swing has been a full cycle from weak to stretched. A drift back toward 50 would be a normal reset in a trend; a fall well below 50 would say more about the trend itself.
⑤ Mansfield Relative Strength

Mansfield RS vs the S&P/ASX 200 is +11.56% and rising. A week ago it was +6.11 and a month ago +1.59, so the reading has gained 5.45 points on the week and 9.97 points on the month — positive and accelerating on both measures. This is the strongest feature of the setup.
For context, the two-year panel shows RS was deeply negative from the December 2025 gap until October 2026; the move above zero is recent. RS can stay strong while price pauses, so the MACD cross does not by itself contradict this reading.
⑥ ATR & ADX

ATR(14) is $0.0596, or 1.76% of price — a quiet, low-volatility name. That puts the 1×ATR reference at $3.32 and the 2×ATR technical invalidation level at $3.26, only about 3.5% below the close.
ADX reads 57.4 on the two-year series and 58.0 on the 90-day series, firmly in strong-trend territory. ADX measures trend strength, not direction; here it confirms that the October–November advance has been a persistent, orderly move. Very high ADX readings also tend to appear late in a leg, when the trend is mature.
⑦ OBV

On the 90-day view OBV is in accumulation — above its 20-day average and rising. Its gap to that average reads 223.9%, but the MA20 is close to zero here, so the percentage overstates the strength; the shape (OBV climbing from its September low to new 90-day highs in November) is the more useful read.
On the two-year view OBV is in early accumulation: above its MA20 (a 14.05% gap) but flat. In absolute terms two-year OBV remains well below its 2025 levels, so volume flow has improved without yet recovering what was lost after the December 2025 gap. No OBV divergence is flagged on either timeframe.
Bull Case vs Bear Case
Bull Case
- SMA5 > SMA20 > SMA60 in place since Oct 21, with all three averages rising.
- Mansfield RS +11.56% vs the S&P/ASX 200, accelerating on both week and month.
- Close above both aVWAPs (90d $3.10, 2y $3.08) — the post-gap anchor has been reclaimed.
- ADX near 57–58 confirms a strong, persistent trend.
- 90d OBV in accumulation and rising; 2y OBV back above its MA20.
- Friday's decline came on average volume (0.99x), not a high-volume reversal.
Bear Case
- MACD crossed below its signal line on Nov 20, ending the run since Sep 25.
- Price slipped back below SMA5 and the 23.6% retracement after failing to extend past $3.45.
- RSI has dropped back from above 70 — upside momentum is fading.
- Unfilled Dec 2025 gap at $3.52–$3.67 is heavy overhead resistance.
- Two-year OBV is flat and far below its 2025 levels.
- ADX this high often marks a mature leg; low ATR means a tight invalidation band.
Scenarios
| Scenario | Probability | Path | Trigger / Invalidation |
|---|---|---|---|
| Shallow pause, trend resumes | 45% | Price consolidates at the $3.32–$3.35 cluster (SMA20, 38.2–50% retracement), then pushes back toward $3.45 and possibly the $3.52 gap edge. | Trigger: daily close back above $3.45 on Vol/Avg above 1. Invalidation: daily close below $3.32. |
| Deeper pullback inside the trend | 35% | MACD cooling extends; price retraces through SMA20 toward the 61.8–78.6% levels ($3.28–$3.24) and possibly the aVWAP/SMA60 cluster near $3.08–$3.10. | Trigger: close below $3.32. Trend structure stays intact while SMA60 ($3.08) holds. |
| Trend failure | 20% | Break below the 2×ATR level and then SMA60, undoing the October–November advance and turning RS lower. | Trigger: close below $3.26, then below $3.08. |
Key Levels & Volatility References
| Price | Role | Basis |
|---|---|---|
| $3.52–$3.67 | Resistance | Unfilled gap from Dec 1, 2025 (upper Bollinger Band $3.53 near the lower edge) |
| $3.45 | Resistance | Nov 12 swing high (90d Fibonacci 0%) |
| $3.38 | Current | Close, Fri Nov 20 |
| $3.35 | Support | 90d Fibonacci 38.2% retracement |
| $3.32 | Support | SMA20 / Bollinger mid ($3.32), 50% retracement ($3.32), 1×ATR ($3.32) |
| $3.26 | Invalidation | 2×ATR technical invalidation level |
| $3.08–$3.10 | Support | SMA60 ($3.08), 2y aVWAP ($3.08), 90d aVWAP ($3.10) |
What to Watch
- Whether the $3.32–$3.35 cluster (SMA20 and the 38.2–50% retracements) contains the pullback on daily closes.
- A daily close back above $3.45 with Vol/Avg above 1 — the first sign the MACD cross was only a pause.
- The MACD histogram: whether it stays shallow and turns back up, or widens below zero.
- Mansfield RS — a pullback with RS still rising differs from one where RS rolls over.
- Price behaviour on any approach to the $3.52–$3.67 gap from December 2025.