Domino's Pizza Enterprises
This analysis is based on closing-price data as of October 23, 2026. Whether you're researching Domino's Pizza Enterprises (DMP) on the ASX or learning how to read stock charts, here are objective support, resistance and technical invalidation levels built from the RSI, MACD and ATR indicators.
Domino's Pizza Enterprises closed at $21.46 on October 23, 12.7% below the $24.58 52-week high and 44.7% above the $14.83 52-week low. On the two-year chart this is still a recovery inside a larger decline — from the mid-$30s in early 2025 to a low near $13 in late 2025, a rebound to the $24 area in early 2026, a second base around $15–$17 into July, and a climb since late July. In the short term the stock is holding a shallow pullback from its $22.20 Oct 9 close: the SMA5 > SMA20 > SMA60 ordering re-formed on Sep 30 is intact and relative strength against the S&P/ASX 200 is clearly positive, but an Oct 20 push stalled at a lower close ($22.01), the MACD line slipped under its signal line on Oct 23, and on-balance volume sits below its 20-day average.
Snapshot as of October 23, 2026
| Item | Value | Reading |
|---|---|---|
| Close | $21.46 | −12.7% from 52w high · +44.7% from 52w low |
| 52-week range | $14.83 – $24.58 | Upper half of the range, still below the early-2026 peak area |
| SMA 5 / 20 / 60 | $21.67 / $21.08 / $20.05 | SMA5 > SMA20 > SMA60 (re-established Sep 30). Close is 1.0% under SMA5, 1.8% over SMA20 and 7.0% over SMA60 |
| Bollinger (20) | $22.95 / $21.08 / $19.20 | Band width 17.81%; close in the upper half, 6.5% below the upper band |
| aVWAP (2y anchor Jul 2, 2025) | $18.07 | Price 18.8% above the long-horizon anchored average |
| aVWAP (90d anchor Aug 26, 2026) | $20.19 | Price 6.3% above the average anchored to the Aug 26 bar |
| RSI(14) | 56.6 | Above the 50 midline, off the near-70 readings of early October; no RSI divergence flagged |
| Mansfield RS (vs the S&P/ASX 200) | +11.40% | Outperforming, slope rising; −0.32 points on the week (slowing) and +7.21 points on the month (accelerating) |
| MACD (12,26,9) | 0.5475 / 0.5597 / −0.0122 | Bearish crossover on Oct 23 — MACD line just below its signal line, both still above zero |
| ADX(14) | 26.7 | Strong-trend reading (26.4 on the two-year frame); measures strength, not direction |
| ATR(14) | $0.690 (3.2%) | 2×ATR spans 6.4% of the share price |
| OBV (2y / 90d) | early distribution / improving | Below MA20 on both frames (2y flat, 90d rising); no OBV divergence flagged |
| Volume vs 20d avg | 0.758× | 305,094 shares against a 402,410 average, on a −1.60% day; in line with a 0.79–1.03× universe median over Oct 19–23 |
| 1×ATR / 2×ATR technical invalidation | $20.77 / $20.08 | Volatility-based structural reference levels below the close |
① Price & Moving Averages
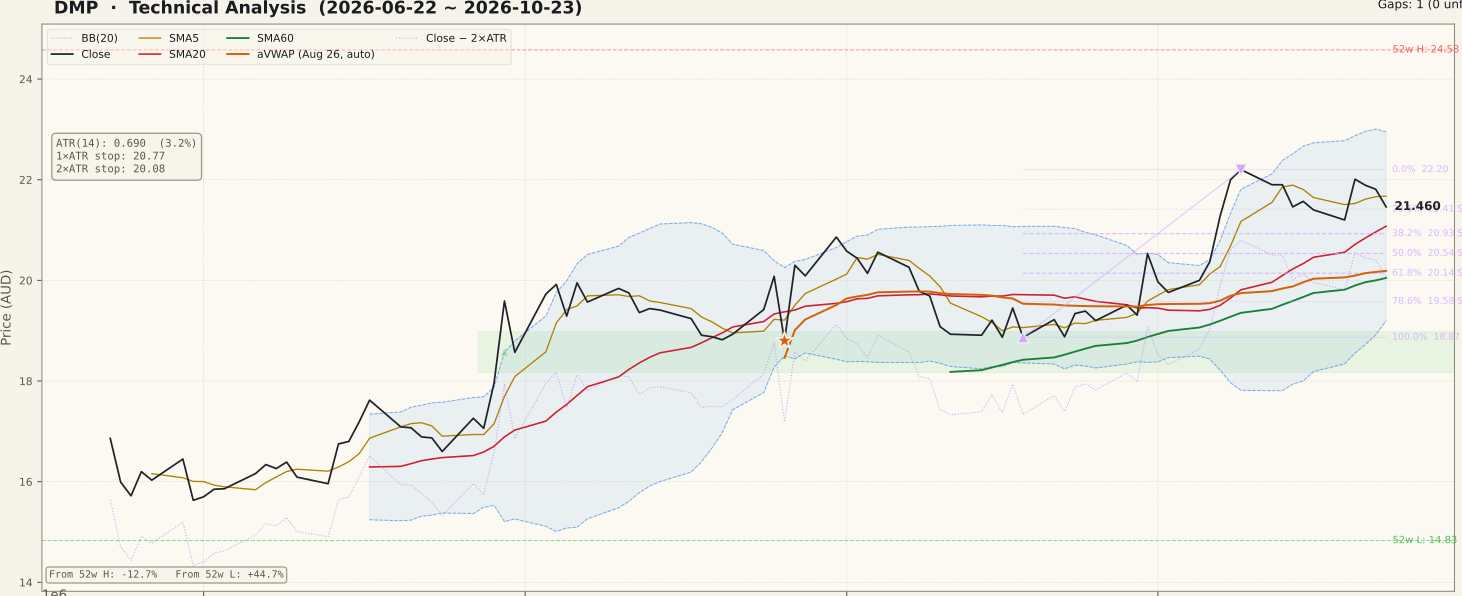
DMP_price-90d-2026-10-25.svgThe two-year frame sets the scale of the current move. From a spike above $35 in early 2025 the share price fell to a low near $13 in late 2025, rebounded to the $24 area by early 2026 (the $24.58 52-week high), then slid back into a $15–$17 base that lasted into July 2026. SMA60 has turned up since the third quarter and price has worked higher since late July, but it remains below the early-2026 peak zone. There are no unfilled gaps on either frame.
On the 90-day frame, the timing of each condition matters. The close has held above SMA60 since Jul 14, and the SMA5 > SMA20 > SMA60 ordering has formed three times in this advance: first on Jul 21 (lost Aug 21), again on Aug 27 (lost Sep 11), and most recently on Sep 30, when a +6.32% session on about 1.5× volume also lifted the close back above SMA20. The Oct 7–9 sessions then set 20-session closing highs up to $22.20. The earlier, larger bars in this window — Jul 30 (+9.1% on about 3.9× volume), Aug 26 (−6.4%, 3.8×) and Aug 27 (+8.0%, 2.3×) — sit well outside the last week; the Aug 26 bar is the anchor of the 90-day aVWAP.
The past two weeks have been a sideways-to-lower drift from that $22.20 close, the 0% end of the Fibonacci swing from the $18.87 low on Sep 18. On Oct 20 price traded up to $22.46 intraday but closed at $22.01, below the Oct 9 close, and the next three sessions eased to $21.46. That leaves the close five cents above the 23.6% retracement ($21.41) and 1.0% under SMA5, with SMA20 ($21.08) and the 38.2% retracement ($20.93) as the next layers beneath. SMA20 has kept rising through the pullback, so the gap between price and the 20-day average has narrowed from both sides.
② Volume

DMP_volume-90d-2026-10-25.svgVolume on Oct 23 was 305,094 shares, 0.758× the 20-day average of 402,410 (the average includes that day). Across the past week the stock traded roughly 0.7–1.2× its average, while the median stock in the screened ASX universe traded 0.79–1.03× its own average — so DMP's participation was ordinary, neither heavy nor unusually thin relative to the market.
The detail is in how volume lined up with price. The Oct 20 advance (+3.82%) came on below-average volume (about 0.96×), and the heaviest session of the week, Oct 21 at about 1.2×, opened at $22.30 and closed at its low of $21.89. The pullback days that followed were light. The busier sessions of the previous week (Oct 15–16, up to 2.18× on Oct 16) fall outside the latest five sessions. Light-volume declines are a milder signal than heavy ones, but the attempt to reclaim the highs also lacked volume support.
③ MACD

DMP_macd-90d-2026-10-25.svgThe MACD line is 0.5475 against a signal of 0.5597, a histogram of −0.0122. The golden cross from Sep 30 gave way to a bearish crossover on Oct 23, after the histogram had narrowed for most of October. The crossover is marginal and occurs well above the zero line, which typically marks a momentum pause inside an uptrend rather than a trend reversal on its own. The MACD line also remains below its August peak, so this leg never produced a momentum high above the summer advance. A quick recross above the signal line would neutralise the signal; a widening negative histogram would confirm a fading short-term trend.
④ RSI

DMP_rsi-90d-2026-10-25.svgRSI(14) is 56.6 (the same on the two-year frame), down from just under 70 around the Oct 9 high. It has held above the 50 midline since late September, and the Oct 20 bounce lifted it only into the low 60s before it eased again. No RSI divergence is flagged in the data. A reading in the mid-50s is neutral-to-firm; a move under 50 would suggest the momentum built from the Sep 30 breakout has been used up.
⑤ Mansfield Relative Strength

DMP_rs-90d-2026-10-25.svgMansfield RS vs the S&P/ASX 200 is +11.40%, outperforming with a rising slope. A week earlier it was +11.725 and a month earlier +4.194, so it is down 0.32 points on the week and up 7.21 points on the month — positive but slightly slowing on the weekly view, positive and accelerating on the monthly view. On the two-year chart, RS spent most of 2025 deeply negative (near −50 at the worst), recovered toward zero in early 2026, dipped again through mid-2026 and has held above zero since late July. Relative strength is the firmest part of this chart: even through the pullback, the stock has kept pace with or beaten the index.
⑥ ATR & ADX

DMP_atr_adx-90d-2026-10-25.svgATR(14) is $0.690, or 3.2% of price, placing the 1×ATR reference at $20.77 and the 2×ATR technical invalidation level at $20.08, 6.4% below the close. ATR has eased from its August–September levels, so daily ranges are calmer than during the late-August swings. ADX is 26.7 on the 90-day frame and 26.4 on the two-year frame, both in strong-trend territory after climbing from around 20 in early October. ADX measures persistence, not direction: it confirms the move since Sep 30 has organised into a trend, not that the trend will continue upward. Note that the $20.08 level sits in a cluster with the 90-day aVWAP ($20.19), the 61.8% retracement ($20.14) and SMA60 ($20.05).
⑦ OBV

DMP_obv-90d-2026-10-25.svgOBV is tagged improving on the 90-day frame (below MA20, slope rising) and early distribution on the two-year frame (below MA20, flat). The 90-day tag reflects a line that recovered strongly from mid-September into October; over the most recent sessions OBV has turned down again and slipped back under its MA20, as the down days subtracted their volume. No OBV divergence is flagged on either frame, and none for RSI.
The OBV-to-MA20 gap is −21.59% on the two-year frame; the 90-day figure of −84.21% overstates the weakness because the 90-day MA20 sits relatively close to zero. These percentages measure distance from the moving average, not divergence. Read together, OBV says the advance since September has not been backed by persistent net volume — a reason for caution, not a signal of a top.
Bull Case vs Bear Case
Bull Case
- SMA5 > SMA20 > SMA60 ordering intact since Sep 30; close above SMA60 since Jul 14
- Mansfield RS +11.40% vs the S&P/ASX 200, up 7.21 points on the month
- ADX 26.7 — the advance has organised into a strong-trend reading
- RSI 56.6 has cooled from near 70 while holding above 50
- Pullback days since Oct 21 came on light volume (0.70–0.76×)
- Price above both anchored VWAPs — $18.07 (Jul 2, 2025) and $20.19 (Aug 26, 2026)
Bear Case
- MACD crossed below its signal line on Oct 23; MACD line never exceeded its August peak
- Oct 20 retest closed at $22.01, a lower close than the $22.20 Oct 9 high, on below-average volume
- OBV below MA20 on both frames; two-year tag is early distribution
- Close 1.0% under SMA5, only five cents above the 23.6% retracement
- Mansfield RS dipped 0.32 points on the week after its early-October peak
- Still 12.7% under the 52-week high, inside a larger two-year decline
Scenarios
| Scenario | Probability | Path | Trigger / Invalidation |
|---|---|---|---|
| Consolidation above SMA20 | 40% | Price ranges between roughly SMA20 ($21.08) and the $22.20 swing high while MACD and RSI reset, with the rising SMA20 catching up to price | Trigger: closes holding above SMA20. The structure holds while closes stay above $20.08 |
| Pullback deepens toward the $20.08–$20.54 cluster | 35% | The MACD crossover widens, price closes under SMA20 and the 38.2% retracement ($20.93), and tests the 50% retracement ($20.54) and the aVWAP / SMA60 cluster near $20.05–$20.19 | Trigger: a close below SMA20 ($21.08). Invalidation of the Sep 30 structure: a daily close below $20.08 (2×ATR technical invalidation) |
| Trend resumes above the swing high | 25% | MACD recrosses its signal line, OBV recovers above its MA20 and price clears the $22.20 Oct 9 close toward the upper Bollinger Band ($22.95) | Trigger: a close above $22.20 on above-average volume. Invalidation: failure back below SMA20 |
Key Levels & Volatility References
| Level | Role | Distance | Basis |
|---|---|---|---|
| $24.58 | Resistance | +14.5% | 52-week high, the peak of the early-2026 rally |
| $22.20 | Resistance | +3.4% | Oct 9 close — 0% of the Fibonacci swing and the recent 20-session closing high; Oct 20 closed below it at $22.01; SMA5 ($21.67) overhead first |
| $21.46 | Current | — | Oct 23, 2026 close |
| $21.41 | Support | −0.2% | Fibonacci 23.6% retracement of the Sep 18 – Oct 9 swing |
| $21.08 | Support | −1.8% | SMA20 / Bollinger mid line; 38.2% retracement ($20.93) and 1×ATR reference ($20.77) below |
| $20.54 | Support | −4.3% | Fibonacci 50% retracement |
| $20.08 | Invalidation | −6.4% | 2×ATR technical invalidation level; 90-day aVWAP ($20.19), 61.8% retracement ($20.14) and SMA60 ($20.05) clustered alongside |
What to Watch
- MACD versus its signal line. The Oct 23 crossover is marginal. A quick recross would neutralise it; a widening negative histogram would confirm momentum is fading.
- SMA20 at $21.08. The rising 20-day average is the first meaningful layer under price. Closes holding above it keep the pullback shallow; closes below would open the 38.2%–50% retracement zone.
- OBV and its MA20. A return above the MA20 on both frames would show net volume backing the trend; further slippage would leave the advance unconfirmed.
- The $22.20 close. The Oct 20 attempt fell short of it on light volume. A close above it on above-average volume would change the short-term picture.
- The $20.08 level. A daily close below the 2×ATR technical invalidation level, alongside the aVWAP and SMA60 cluster, would undo the structure built since Sep 30.