Alkane Resources
This analysis is based on closing-price data as of August 28, 2026. Whether you're researching Alkane Resources (ALK) on the ASX or learning how to read stock charts, here are objective support, resistance and technical invalidation levels built from the RSI, MACD and ATR indicators.
Alkane Resources closed the week at $1.93, just 3.3% under the $1.99 52-week high it printed two sessions earlier on August 26 and 118.8% above the $0.88 low of November 21, 2025. The two-year picture is a long base that finally resolved: the stock spent late 2024 and the first half of 2025 in the 40- to 70-cent range, re-rated through the December-to-February stretch, then gave most of a year's gains back between February and July before turning again. What makes the current chart unusual is the speed of the turn — price is up 47.5% from the July 17 close of $1.31 in thirty sessions, Mansfield relative strength versus the S&P/ASX 200 has swung from −2.3% a month ago to +35.0% now, and ADX at 34.7 confirms a trend that has genuinely established itself rather than merely bounced. The counterweight is equally plain: RSI is at 74.1, the close sits 17.3% above its own SMA20, and the last two sessions have drifted lower on below-average volume. This is a shallow pullback at the very top of the range, and everything on this page is measured against an ATR of 4.11% of price.
Snapshot as of August 28, 2026
| Item | Value | Reading |
|---|---|---|
| Close | $1.93 | −3.3% from 52w high · +118.8% from 52w low |
| 52-week range | $0.88 – $1.99 | At the very top of a range that has more than doubled in a year |
| SMA 5 / 20 / 60 | $1.92 / $1.64 / $1.49 | Full upward alignment; close 0.4% above SMA5, 17.3% above SMA20, 28.8% above SMA60, with the two longer averages rising |
| Bollinger (20) | $2.05 / $1.64 / $1.24 | Band width 49.2% — expanded, not compressed; price rides the upper half with the upper band 6.3% overhead |
| aVWAP (2y anchor Mar 20, 2026) | $1.55 | Price 24.0% above — the average position taken since the March anchor is onside |
| aVWAP (90d anchor Jul 23, 2026) | $1.60 | Price 20.6% above — positioning since the late-July turn is onside as well |
| RSI(14) | 74.1 (90d) / 74.0 (2y) | Above the 70 line on both frames; no divergence recorded on either |
| Mansfield RS (vs the S&P/ASX 200) | +35.0% | +7.90 on the week and +37.29 on the month — positive and accelerating, from −2.28 four weeks ago |
| MACD (12,26,9) | 0.136 / 0.099 / +0.037 | Golden cross Jul 23, 2026; both lines above zero, histogram positive |
| ADX(14) | 34.7 (90d) / 34.3 (2y) | Strong — comfortably above the 25 threshold on both frames |
| ATR(14) | $0.079 (4.11%) | Elevated for a producer-scale name; ordinary daily noise spans roughly eight cents |
| OBV (2y / 90d) | accumulation / accumulation | Both above MA20 and rising; 2y spread +7.74%, 90d spread +91.28% (see section ⑦ for what that percentage measures) |
| Volume vs 20d avg | 0.85× | 5,231,073 shares against a 6,146,771 average — the advance's heaviest bars were 1.56× and 1.49× earlier in the week |
| Unfilled gap | $1.61–$1.65 | Aug 20, 2026 support gap, 14.3% beneath the close; nine other gaps recorded on the two-year frame have been filled |
| 1×ATR / 2×ATR technical invalidation | $1.85 / $1.77 | Volatility-based structural reference levels, 4.1% and 8.2% below the close |
① Price & Moving Averages
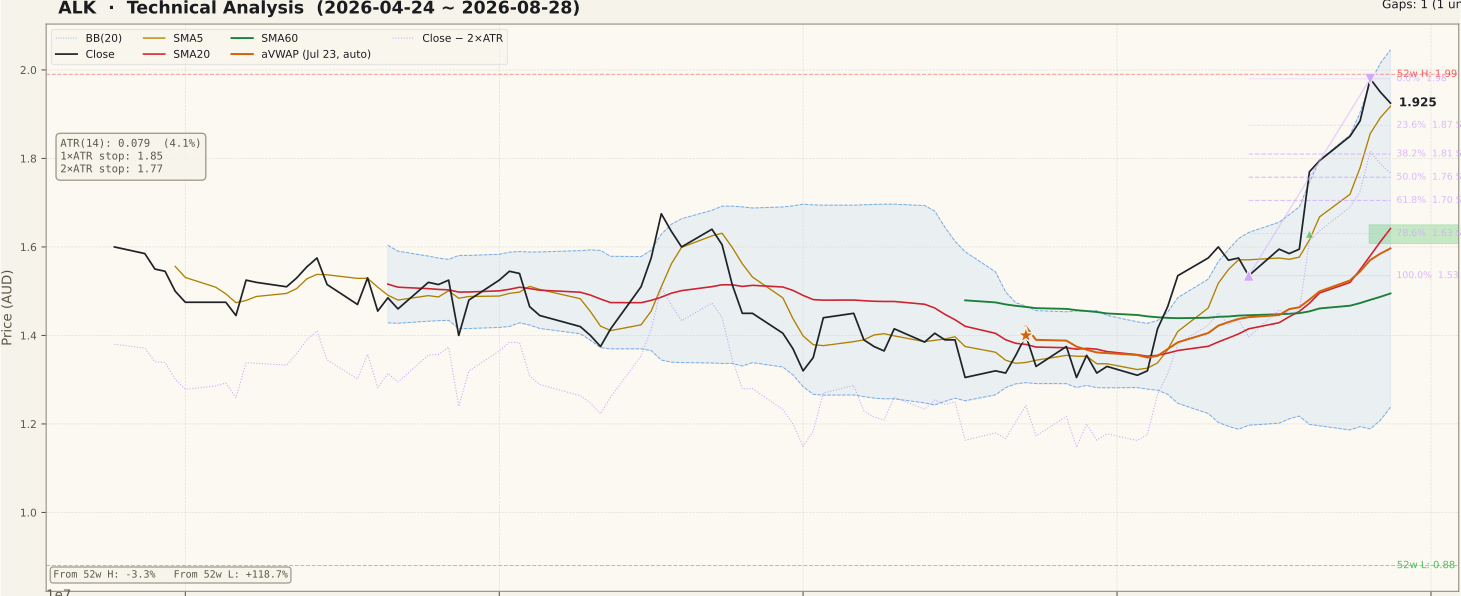
ALK_price-90d-2026-08-30.svgThe averages are in textbook upward order: close $1.93, SMA5 $1.92, SMA20 $1.64, SMA60 $1.49, each above the next, with the two longer lines pointing higher. The close sits only 0.4% above the SMA5, which is the definition of a shallow pullback — price has come back to the fastest average rather than through it. The wider spacing is the more instructive figure: the SMA20 is 9.8% above the SMA60 and the close is 17.3% above the SMA20. Averages stretched that far apart are the arithmetic residue of a near-vertical move, and they converge either by price pausing while the lines catch up or by price retracing toward them.
Bollinger Bands frame the range at $1.24 to $2.05 around a $1.64 mid, with band width at 49.2%. That is expansion rather than compression — the bands opened as the August advance ran, and the close now sits 6.3% below the upper edge rather than pinned against it, which is what a pause inside a band-walk looks like. Both anchored VWAPs are underneath the market: $1.55 on the two-year anchor of March 20, 2026 and $1.60 on the 90-day anchor of July 23, 2026, leaving price 24.0% and 20.6% clear of them respectively. There is no overhead supply shelf from either anchor. The 90-day retracement grid is drawn up from the August 14 low of $1.53 to the August 26 high of $1.98, so its levels sit beneath the close as pullback structure: 23.6% at $1.87, 38.2% at $1.81, 50% at $1.76 and 61.8% at $1.70. Price has given back only about an eighth of that swing so far. Below all of it lies the one unfilled gap on the chart, $1.61 to $1.65, left by the August 20 session.
② Volume

ALK_volume-90d-2026-08-30.svgFriday traded 5,231,073 shares against a 20-day average of 6,146,771 — a Vol/Avg ratio of 0.85×. On its own that is unremarkable, but the sequence around it is not. The August 24 session traded 1.56× the average and the August 26 session that printed the $1.99 high traded 1.49×, while the two down sessions that followed came in at 0.94× and 0.85×. Volume expanding into the advance and contracting into the drift back is the pattern a healthy pause produces; the opposite arrangement would be the concerning one.
The August 20 bar deserves separate mention because it is the origin of the whole move. Price opened at $1.65 against the previous session's $1.61 high — the gap that remains unfilled — and closed 11.0% higher at $1.77 on 1.16× average volume. That is a genuine gap-and-go, though the volume behind it was closer to average than to exceptional, which is worth holding in mind before treating the level as unassailable. Turnover at the last close was roughly A$10.1 million, so this is not a thin-liquidity situation where a single order distorts the tape.
One market-specific caveat applies regardless of what the panel shows: this is a Materials-sector resources name, and ASX gold and critical-minerals companies reprice on drilling results, resource upgrades and project announcements that no volume pattern anticipates. Chart mechanics describe how the market has absorbed information, not what information is coming.
③ MACD

ALK_macd-90d-2026-08-30.svgThe MACD line reads 0.136 against a signal line at 0.099, leaving the histogram positive at +0.037. The last crossover was a golden cross on July 23, 2026 — four days after the July low — and it has not been challenged since. Both lines are well above zero, which distinguishes this from an early-stage cross fired from deep negative territory.
The honest qualification is that a positive histogram this wide is a late-stage reading rather than an early one. The distance between the two lines is a function of how fast price accelerated in the past fortnight, and that distance narrows either because price consolidates or because it retraces. Momentum indicators built on moving-average differences always flag the strongest part of a move after it has happened; what the panel confirms here is that the July turn has not yet been contradicted, not that the next leg is already underway.
④ RSI

ALK_rsi-90d-2026-08-30.svgRSI(14) prints 74.1 on the 90-day frame and 74.0 on the two-year frame — effectively the same reading, and above the conventional 70 line on both. The JSON records no divergence on either timeframe, and no divergence peaks, so there is nothing on this panel that argues price and momentum have parted company.
This is where inexperienced readings most often go wrong. An RSI above 70 is not a reversal signal; in a trend with ADX above 30 it is the ordinary condition of a market that is going up, and readings can stay there for weeks while price walks the upper Bollinger Band. What a 74 reading does mean is that the indicator has very little room left to expand, so further upside has to come from price rather than from momentum widening. The reading that would change the picture is a lower price high set against a lower RSI high — a bearish divergence — and that has not formed. Until it does, 74.1 is a description of trend intensity, not a warning about it.
⑤ Mansfield Relative Strength

ALK_rs-90d-2026-08-30.svgMansfield relative strength versus the S&P/ASX 200 reads +35.0%, with a rising slope and the same value on both timeframes as the measure is anchor-free. A week ago the line stood at +27.11 and four weeks ago at −2.28, so the changes are +7.90 on the week and +37.29 on the month. Both are positive while the line itself is positive, which places the stock in the accelerating outperformance quadrant — the strongest of the four states this indicator can occupy.
The month-long swing is the striking part. A move from marginally below zero to +35 in four weeks means the stock did not merely rise, it rose while the index did comparatively little, and it did so from a starting point where it was a fractional underperformer. That is a genuine change of leadership rather than a beta effect. The caution attached is symmetric: relative strength that steepens this quickly has, by construction, no established shelf beneath it on the RS panel itself. A first weekly change back toward zero would not end the outperformance — the line would still be far above zero — but it would mark the point at which the acceleration stopped, and that is usually visible on this panel before it is obvious on price.
⑥ ATR & ADX

ALK_atr_adx-90d-2026-08-30.svgADX(14) is 34.7 on the 90-day frame and 34.3 on the two-year frame, both comfortably in the "strong trend" band above 25. ADX measures conviction rather than direction, so the reading has to be paired with the price panel to be meaningful — and there the direction is unambiguously up, with every average aligned and rising. A trend at this ADX level is established rather than emerging.
ATR(14) is $0.079, or 4.11% of the close. That is the practical constraint on every level quoted here: an eight-cent average daily range means the distance from the close to the 23.6% retracement at $1.87 is barely three-quarters of one day's normal movement. Levels that look meaningfully separated on a chart of a $1.93 stock are, in volatility terms, adjacent. The 1×ATR reference sits at $1.85 and the 2×ATR technical invalidation level at $1.77, 4.1% and 8.2% below the close respectively — the second of those falls just beneath the 50% retracement at $1.76, which is a useful confluence to note.
⑦ OBV

ALK_obv-90d-2026-08-30.svgBoth timeframes report the same state. The two-year window shows OBV at 354,774,921 against a 20-day average of 329,275,281, above its average with a rising slope and a spread of +7.74%. The 90-day window shows OBV at −2,434,573 against an MA20 of −27,934,213, also above its average, also rising, with a spread of +91.28%. No divergence is recorded on either frame.
Two details need care before either number is read as a signal. First, the 90-day OBV series is re-based to the start of its own window, so the negative absolute value simply says that across the whole of the past 90 days — which includes the long slide into the July low — down-volume slightly exceeded up-volume. It is a statement about the window, not about the present. Second, the +91.28% figure is not a divergence: it measures the distance between OBV and its own 20-day average, and because that average is itself a negative number close to the series' own scale, the percentage inflates. The two-year +7.74% is computed off a very large positive base and understates the same underlying flow. Neither percentage should be compared with the other.
Stripped of the arithmetic, the signal that survives is the one both frames agree on: OBV is above its moving average and rising on the long frame and the short frame simultaneously, which is the cleanest configuration this indicator offers. The constructive continuation would be that slope staying positive while price consolidates under $1.98; the warning would be OBV rolling under its MA20 while price is still near the high, which is the classic non-confirmation.
Bull Case
- Complete upward moving-average alignment — close $1.93 above SMA5 $1.92 above SMA20 $1.64 above SMA60 $1.49, with the longer averages rising.
- Mansfield RS +35.0% versus the S&P/ASX 200, and accelerating: +7.90 on the week, +37.29 on the month from a −2.28 reading four weeks ago.
- ADX 34.7 (90d) and 34.3 (2y) — both well above the 25 threshold, describing an established trend rather than a bounce.
- MACD golden cross of Jul 23, 2026 intact, both lines above zero and the histogram positive at +0.037.
- OBV above its MA20 with a rising slope on both timeframes — the two frames agree on flow direction without qualification.
- Both anchored VWAPs sit far below price ($1.55 two-year, $1.60 90-day), so there is no overhead supply shelf from either anchor.
Bear Case
- RSI 74.1 on both frames — above the 70 line, with little room for momentum itself to expand further.
- The close is 17.3% above the SMA20 $1.64 and 28.8% above the SMA60 $1.49; averages stretched that far converge by pausing or by retracing.
- Price is 3.3% under the $1.99 52-week high with no prior structure overhead — the chart offers no reference above the August 26 peak.
- Bollinger width 49.2% is expansion, not compression; the bands have already done their widening and the upper edge $2.05 is only 6.3% away.
- ATR at 4.11% of price puts ordinary daily noise at roughly eight cents, so the 23.6% retracement $1.87 is less than one average day beneath the close.
- A Materials-sector resources name whose repricing has historically come from announcements — the two-year record includes single sessions of −14.0% (Mar 23, 2026) and +11.4% (Feb 16, 2026).
Scenarios
| Scenario | Probability | Path | Trigger / Invalidation |
|---|---|---|---|
| Pause resolves upward through the high | ~40% | The SMA5 $1.92 catches the drift, price reclaims $1.98 and clears the $1.99 52-week high, and the band-walk resumes toward the upper Bollinger Band at $2.05 with Mansfield RS still accelerating from +35.0%. | Trigger: a daily close above $1.99 on volume above the 6,146,771 20-day average. Invalidated by a daily close below the 23.6% retracement at $1.87. |
| Sideways digestion under the high | ~40% | Price ranges between the 23.6% retracement $1.87 and the $1.98 August 26 high while RSI unwinds from 74.1 through time rather than through price; the SMA20 $1.64 climbs toward the close and Bollinger width contracts from 49.2%. | Trigger: successive closes inside the $1.87–$1.98 band with volume decaying toward 1.0×. Resolved when either boundary gives way on a daily close. |
| Deeper retracement into the swing grid | ~20% | $1.87 gives way, opening the 1×ATR reference $1.85 and the 38.2% retracement $1.81, then the 50% level $1.76 where the 2×ATR technical invalidation level $1.77 sits alongside it; beneath that lie the unfilled Aug 20 gap $1.61–$1.65 and the SMA20 $1.64. | Trigger: a daily close below $1.87. A daily close below $1.77 — the 2×ATR technical invalidation level — ends the structure described on this page. |
Key Levels & Volatility References
| Level | Role | Basis |
|---|---|---|
| $2.05 | Resistance | Upper Bollinger Band (20, 2σ), 6.3% above the close — the only overhead reference the chart provides beyond the 52-week high |
| $1.99 | Resistance | 52-week high, printed intraday on Aug 26, 2026 |
| $1.98 | Resistance | Aug 26, 2026 closing high; 0% anchor of the Aug 14–26 up-swing grid |
| $1.93 | Current close | Aug 28, 2026 close, on 0.85× the 20-day average volume |
| $1.92 | Support | SMA5 — the first average beneath the close, 0.4% away |
| $1.87 | Support | 23.6% retracement of the Aug 14–26 swing; the 1×ATR reference $1.85 sits immediately below |
| $1.77 | Invalidation | 2×ATR technical invalidation level, 8.2% below the close, just under the 50% retracement at $1.76 |
What to Watch
- Whether the $1.98–$1.99 ceiling is cleared on a daily close with turnover above the 6,146,771 20-day average. The two sessions since that high traded 0.94× and 0.85× — light enough to read as digestion, but not yet evidence of renewed demand.
- The SMA5 at $1.92, only 0.4% under the close. It is the first average in the stack, and whether the drift stops there or runs through it distinguishes a pause from the start of a retracement toward the far wider SMA20 at $1.64.
- RSI 74.1 and how it unwinds. Time-based unwinding — the reading easing while price ranges — is continuation behaviour. A lower price high against a lower RSI high would be the first bearish divergence on this chart; none is recorded at present.
- Mansfield RS versus the S&P/ASX 200: +35.0% and +7.90 on the week. A weekly change flattening toward zero would mark the end of the acceleration phase without ending the outperformance, and it typically shows on this panel before price reflects it.
- The $1.61–$1.65 gap of Aug 20, 2026, 14.3% beneath the close and the only unfilled gap on the chart. Unfilled gaps act as magnets as often as they act as floors, so it is the deeper structural reference for anything beyond the 2×ATR level.