Sunrise Energy Metals
This analysis is based on closing-price data as of August 28, 2026. Whether you're researching Sunrise Energy Metals (SRL) on the ASX or learning how to read stock charts, here are objective support, resistance and technical invalidation levels built from the RSI, MACD and ATR indicators.
Sunrise Energy Metals finished the week at $17.17, which is 16.2% under the $20.50 intraday 52-week high printed on August 10, 2026 and 973.1% above the $1.60 low at the other end of the same range. The two-year chart is a re-rating rather than a trend: price traded in low single digits through 2025 and into 2026 before a step-change in August, and the two-year anchored VWAP of $8.31 still sits less than half the current price. What the 90-day frame shows is the aftermath of that step-change — a spike to $19.00 on August 11, a five-week give-back to $15.79 on August 24, and a recovery over the last four sessions that has brought the close back above the SMA20 at $16.86 and the SMA60 at $16.18. Mansfield relative strength versus the S&P/ASX 200 reads +69.2% and is accelerating, but ADX at 16.0 says no directional trend is currently being registered, and an ATR of 6.4% of price makes every reference level on this page a wide one.
Snapshot as of August 28, 2026
| Item | Value | Reading |
|---|---|---|
| Close | $17.17 | −16.2% from 52w high · +973.1% from 52w low |
| 52-week range | $1.60 – $20.50 | The high printed intraday on Aug 10, 2026 — 14 sessions before this close |
| SMA 5 / 20 / 60 | $16.78 / $16.86 / $16.18 | Close above all three, but the SMA5 has slipped fractionally beneath the SMA20 — the stack is not fully aligned |
| Bollinger (20) | $19.22 / $16.86 / $14.50 | Band width 27.99% — wide, not compressed; the close sits just above the mid-line |
| aVWAP (2y anchor Apr 11, 2025) | $8.31 | Price 106.7% above — the average position taken since the 2025 anchor is deeply onside |
| aVWAP (90d anchor Aug 10, 2026) | $18.03 | Price 4.8% below — the average position taken since the August surge is offside, an overhead supply shelf |
| RSI(14) | 54.7 | Above the 50 pivot on both frames, clear of 30 and 70; no divergence recorded and no peaks supplied |
| Mansfield RS (vs the S&P/ASX 200) | +69.2% | Outperform with a rising slope — +8.10 on the week and +8.19 on the month, so positive and accelerating |
| MACD (12,26,9) | 0.279 / 0.302 / −0.023 | Dead cross Aug 21, 2026; both lines remain above zero and the histogram is only marginally negative |
| ADX(14) | 16.0 (90d) / 15.8 (2y) | Ranging — below the 20 line on both frames; no directional conviction is being measured |
| ATR(14) | $1.102 (6.42%) | High — a 6.4% average daily range pushes every volatility-derived reference far from price |
| OBV (2y / 90d) | early accumulation / accumulation | Both above their MA20; the 2y slope is flat at +1.42%, the 90d slope rising at +5.32% |
| Volume vs 20d avg | 0.375× | 253,686 shares against a 676,485 average — the recovery has come on thinning turnover |
| Unfilled gaps | none (90d) | The August 10 gap has been fully retraced; six older support gaps sit between $0.47 and $5.25, all from 2025 |
| 1×ATR / 2×ATR technical invalidation | $16.07 / $14.97 | Volatility-based structural reference levels, 6.4% and 12.8% below the close |
① Price & Moving Averages
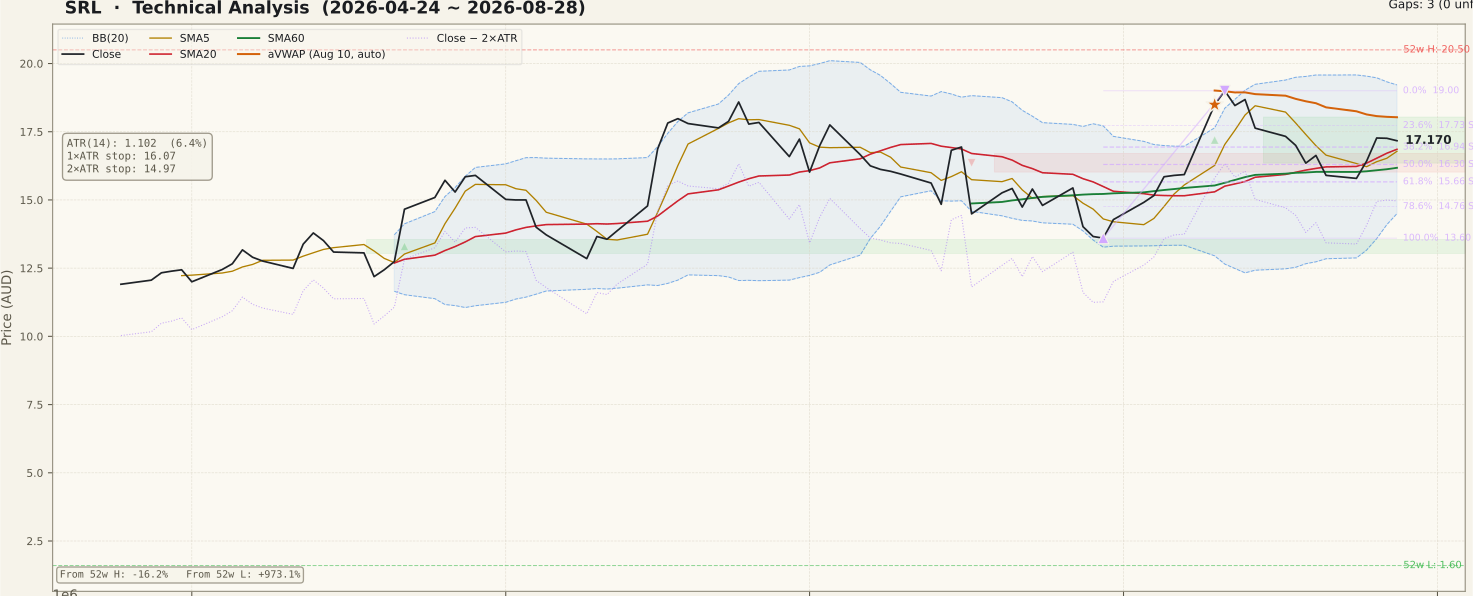
SRL_price-90d-2026-08-30.svgThe $17.17 close is above all three averages — SMA5 $16.78, SMA20 $16.86 and SMA60 $16.18 — but the order of those averages is not the textbook upward stack. The SMA5 has slipped fractionally beneath the SMA20, which is the arithmetic residue of the five-week give-back from the August 11 high: the fastest average absorbed the decline first and has not yet caught back up. Price sitting 1.9% above the SMA20 and 6.1% above the SMA60 while the two shortest lines cross over each other is the signature of a pullback that has turned but has not yet re-established a sequence.
Bollinger Bands frame the range at $14.50 to $19.22 around a $16.86 mid, with band width at 27.99%. Those bands are wide rather than compressed — they are still carrying the volatility of the August surge — and the close is essentially on the mid-line rather than at either edge. The 90-day retracement grid is drawn from the July 30 low of $13.60 to the August 11 high of $19.00, and the close sits between the 23.6% level at $17.73 above and the 38.2% level at $16.94 below. The anchored VWAPs disagree deliberately: the two-year line at $8.31 (anchored April 11, 2025) leaves price 106.7% clear, while the 90-day line at $18.03 (anchored August 10, 2026) sits 4.8% overhead. Everyone positioned since the surge day is, on average, underwater; everyone positioned since early 2025 is not.
② Volume

SRL_volume-90d-2026-08-30.svgFriday traded 253,686 shares against a 20-day average of 676,485 — a Vol/Avg ratio of 0.375×, and the lightest session in the recent sequence. The four-session recovery off the August 24 low ran 555,357, 596,222, 640,025, 320,406 and then 253,686 shares: turnover built into the August 26 advance and has decayed since. A move higher on progressively lighter volume is the single weakest link in the near-term structure, because it means the recovery has not been confirmed by participation.
The context on the same panel is the August 10 session, which traded 2,613,267 shares — roughly 3.9 times the current 20-day average — and opened at $18.11 against a prior close of $15.93, printing the $20.50 52-week high intraday before settling at $18.49. That is 14 trading sessions back, well outside the five-session recency window this page applies to shock detection, so it is recorded here as history rather than as a live warning. It nevertheless explains the shape of everything since: the entire 90-day structure above $16 was created in one session.
Two market-specific caveats. This is a Materials-sector name, and ASX small and mid-cap resources stocks reprice on drilling, resource and offtake announcements rather than on chart mechanics — volume spikes in this cohort frequently carry news that price data alone cannot identify. Capital raisings in the same cohort are conventionally accompanied by a trading halt of a couple of sessions, so blank stretches on a resources chart are not automatically data errors.
③ MACD

SRL_macd-90d-2026-08-30.svgMACD crossed below its signal line on August 21, 2026 — MACD 0.279 against a signal of 0.302, with a histogram of −0.023. Both readings are essentially identical on the two-year frame (0.281 / 0.304 / −0.024), so the two timeframes agree.
Two qualifications matter here. First, both lines remain well above zero, so what has happened is a loss of upward acceleration inside positive momentum rather than a shift into negative momentum — a distinction that separates a pause from a turn. Second, the histogram is only −0.023 deep against an ATR of $1.10, which makes it one of the shallowest negative readings the indicator can produce on a stock of this volatility. The honest reading of this panel is that momentum went flat in the third week of August and has not yet resolved either way; the cross is real, but the separation between the lines is close to nothing.
④ RSI

SRL_rsi-90d-2026-08-30.svgRSI reads 54.7 on both the 90-day and two-year frames — above the 50 pivot, a long way from the 70 overbought line and further still from 30. No divergence is recorded on either oscillator and no divergence peaks are supplied, so there is nothing on this panel to read as exhaustion or as a bottoming signal.
The value of the reading is what it rules out. A stock that has retraced 16.2% from a 52-week high in three weeks could plausibly be oversold; it is not. A stock that has bounced 8.7% off its August 24 low in four sessions could plausibly be overbought; it is not either. RSI in the mid-50s after both of those moves describes a market that has given back its excess in both directions and is sitting close to balance. Reading peaks into the shape of the line when the divergence field is null is the most common error this indicator invites, and that field is null here on both timeframes.
⑤ Mansfield Relative Strength

SRL_rs-90d-2026-08-30.svgMansfield RS versus the S&P/ASX 200 stands at +69.2%, tagged outperform with a rising slope. A week ago the reading was +61.11% and a month ago +61.02%, so the change is +8.10 on the week and +8.19 on the month. In positive territory a positive change is acceleration — the strongest of the four relative-strength quadrants, and the most constructive single reading on this page.
The nuance is that almost the entire monthly gain arrived in the last week: the month change (+8.19) and the week change (+8.10) are nearly the same number, which means relative strength was flat for three weeks and then jumped. That is consistent with the price sequence — a fade through mid-August while the index did not fade, followed by a sharp four-session recovery. Two cautions follow. Relative strength at this altitude is a function of an extraordinary twelve-month advance off $1.60, so the level says far less about the next fortnight than the slope does. And an anchor-free measure this stretched has a great deal of room to fall before it ceases to describe outperformance, which means a decline in the line would not by itself change the classification.
⑥ ATR & ADX

SRL_atr_adx-90d-2026-08-30.svgATR(14) is $1.102, or 6.42% of price. That figure sizes every volatility-derived reference on the page: one ATR below the close sits at $16.07 and the 2×ATR technical invalidation level at $14.97, which is 12.8% beneath the close. It is also the most practically important number here, because a 6.4% average daily range means an ordinary session on this name covers ground that would constitute a decisive break on a large-cap. The $16.94 shelf immediately below the close is less than one ATR away, so it can be crossed in a single unremarkable day.
ADX(14) reads 16.0 on the 90-day frame and 15.8 on the two-year frame — below the 20 line that marks a trend even beginning to form. That is the reading most at odds with the rest of the page. Relative strength describes a market leader; ADX describes a stock with no measurable directional persistence. Both are true, and they are measuring different things: ADX registers accumulated directional travel, and a vertical one-day re-rating followed by a three-week fade and a four-day bounce produces a great deal of movement with very little net direction. The practical implication is that the range between the August 11 high and the July 30 low is the operative structure, not a trend line.
⑦ OBV

SRL_obv-90d-2026-08-30.svgThe two timeframes agree on direction and differ on intensity. The 90-day window reads accumulation: OBV at 11,317,772 against a 20-day average of 10,746,524, slope rising, 5.32% above that average. The two-year window reads early accumulation: OBV at 40,724,580 against an MA20 of 40,153,332, but with a flat slope and a milder 1.42% separation.
The difference in percentage is a scale effect rather than a contradiction — the two-year series has accumulated across the whole re-rating, so its average is large and a fortnight of flow barely moves it. The short frame is where the information is, and it says flow has been net positive through the give-back. Note the field convention: that 5.32% is the separation between OBV and its own 20-day average, a measure of flow intensity, and it is not a divergence reading. The divergence fields themselves are null on both timeframes, so no price-versus-flow divergence is recorded here, and none should be inferred from the shape of the line.
Bull Case
- Mansfield RS +69.2% versus the S&P/ASX 200 with a rising slope — +8.10 on the week and +8.19 on the month, the positive-and-accelerating quadrant.
- The close is above all three moving averages, 1.9% clear of the SMA20 $16.86 and 6.1% clear of the SMA60 $16.18.
- Two-year aVWAP $8.31 leaves price 106.7% above the long-run average position — no overhead supply from that anchor.
- OBV is above its MA20 on both frames; the 90-day state is accumulation with a rising slope and 5.32% separation.
- RSI 54.7 above the 50 pivot on both timeframes, with no divergence recorded — the 16.2% give-back unwound the August excess without breaking the pivot.
- No unfilled gaps remain in the 90-day window; the August 10 gap has been fully retraced, so there is no unfinished business immediately beneath the market.
Bear Case
- MACD dead cross of Aug 21, 2026 with the histogram at −0.023 — upward momentum has stalled, even with both lines above zero.
- The SMA5 $16.78 has slipped beneath the SMA20 $16.86, so the average stack is no longer in upward order.
- The 90-day aVWAP $18.03 sits 4.8% overhead — the average position taken since the August 10 surge is offside, which is a supply shelf.
- ADX 16.0 (90d) and 15.8 (2y) are both under the 20 line; no directional conviction is being registered on either frame.
- Volume at 0.375× the 20-day average, decaying across the four-session recovery (640,025 → 320,406 → 253,686) — an advance without participation.
- ATR at 6.42% of price puts the 2×ATR technical invalidation level 12.8% below the close, and the nearest shelf $16.94 is less than one ATR away.
Scenarios
| Scenario | Probability | Path | Trigger / Invalidation |
|---|---|---|---|
| Recovery extends through the retracement grid | ~40% | Price stays above the $16.94 38.2% level and the $16.86 SMA20, the SMA5 crosses back over the SMA20, the MACD histogram returns above zero, and the 23.6% level at $17.73 and the 90-day aVWAP at $18.03 are reclaimed on rising rather than falling turnover. | Trigger: a daily close above $17.73 on above-average volume. Invalidated by a daily close below $16.86. |
| Range holds between the August extremes | ~40% | The August 21 dead cross and the 16.0 ADX prevail: price oscillates between the $16.94/$16.86 shelf and the $18.03 aVWAP without resolving, band width narrows from 27.99%, and relative strength flattens after the one-week jump. | Trigger: continued closes inside $16.86–$18.03 with volume near or below the 676,485 average. Resolved by a daily close outside that band. |
| Give-back resumes toward the swing origin | ~20% | The $16.86 SMA20 gives way, opening the 50% level at $16.30, the SMA60 at $16.18 and the 61.8% level at $15.66, with the $14.97 invalidation level, the 78.6% level at $14.76 and the lower Bollinger Band at $14.50 clustered beneath — and the $13.60 July 30 swing origin below all of them. | Trigger: a daily close below the 2×ATR technical invalidation level at $14.97 — that ends the August structure described above. |
Key Levels & Volatility References
| Level | Role | Basis |
|---|---|---|
| $19.00 | Resistance | Aug 11, 2026 swing-high close and the 0% anchor of the 90-day retracement grid; the upper Bollinger Band $19.22 and the $20.50 intraday 52-week high sit just above |
| $18.03 | Resistance | 90-day anchored VWAP, anchored Aug 10, 2026 — 4.8% overhead, the average position taken since the surge session |
| $17.73 | Resistance | 23.6% retracement of the Jul 30 – Aug 11 up-swing; the first grid line above the close |
| $17.17 | Current close | Aug 28, 2026 close, on 0.375× the 20-day average volume |
| $16.94 | Support | 38.2% retracement, with the SMA20 and the Bollinger mid-line converging just beneath at $16.86 — the nearest shelf, less than one ATR away |
| $16.18 | Support | SMA60, bracketed by the 50% retracement at $16.30 above and the 1×ATR reference at $16.07 below |
| $14.97 | Invalidation | 2×ATR technical invalidation level, 12.8% below the close; the 78.6% retracement $14.76 and the lower Bollinger Band $14.50 sit immediately beneath |
What to Watch
- Whether volume rebuilds on up sessions. The four-day recovery ran 640,025 then 320,406 then 253,686 shares against a 676,485 average — the advance is currently unconfirmed by participation, and that is the clearest weakness on the page.
- The $16.94/$16.86 shelf, where the 38.2% retracement, the SMA20 and the Bollinger mid-line converge within eight cents. It sits less than one ATR beneath the close, so a single ordinary session can cross it in either direction.
- The SMA5 to SMA20 relationship: $16.78 against $16.86. The fast average crossing back above the medium one would restore the upward order that the August fade removed.
- The 90-day aVWAP at $18.03 — the level that separates a range from a resumed advance. Until price closes above it, everyone positioned since August 10 is on average offside, and that supply is what caps the upper half of the range.
- ADX at 16.0 with Mansfield RS at +69.2%. Those two readings currently disagree; ADX lifting through 20 while RS keeps accelerating would resolve the disagreement in favour of a genuine trend, while ADX staying under 20 keeps the range interpretation in force.