AMP Limited
$2.61 −2.06% from the 52-week high of $2.665 · +128.95% from the 52-week low of $1.14
This analysis is based on closing-price data as of September 25, 2026. Whether you're researching AMP Limited (AMP) on the ASX or learning how to read stock charts, here are objective support, resistance and technical invalidation levels built from the RSI, MACD and ATR indicators.
On the two-year panel AMP has moved from a 52-week low of $1.14 in March to a close of $2.61, 128.95% higher and 2.06% under the 52-week high of $2.665 set intraday on September 24. The screen flagged a breakout this week: on Thursday the stock closed at a 20-day high of $2.66, one session after MACD crossed back above its signal line on September 23, and on Friday it gave back 1.88% on below-average volume. The trend beneath that is not new — SMA5 above SMA20 above SMA60 has held in rising order since June 18, about seventy-two sessions — so the useful question for this page is not whether a trend exists but how much fresh information the week's push added, and the honest answer is that the volume evidence is modest rather than emphatic.
Snapshot as of September 25, 2026 close
| Metric | Value | Reading |
|---|---|---|
| Close | $2.61 | 1.88% below Thursday's 20-day-high close of $2.66 |
| 52-week high / low | $2.665 / $1.14 | 2.06% under the high; 128.95% above the low |
| SMA5 / SMA20 / SMA60 | $2.596 / $2.4995 / $2.253 | Rising order since June 18; close above all three (+0.54% / +4.42% / +15.85%) |
| Bollinger upper / mid / lower | $2.6365 / $2.4995 / $2.3625 | Close 1.01% under the upper rail; width 10.96% |
| aVWAP (2y, anchor Feb 12, 2026) | $1.7252 | Close 51.29% above |
| aVWAP (90d, anchor Jul 16, 2026) | $2.3084 | Close 13.07% above |
| RSI(14) | 68.42 (90d) / 68.42 (2y) | Just under the 70 line; no RSI divergence reported |
| Mansfield RS vs the S&P/ASX 200 | +52.67% | Outperform, rising (prev week 47.90, prev month 36.52) |
| MACD / signal / histogram | 0.0790 / 0.0745 / +0.0045 | Golden cross dated September 23, 2026 — three sessions old |
| ADX(14) | 57.92 (90d) / 57.77 (2y) | Deep in the strong-trend band on both frames |
| ATR(14) | $0.0652 (2.50%) | About 6.5 cents of average daily range |
| OBV state | 90d accumulation, rising · 2y accumulation, rising | Above its MA20 on both frames (+21.94% / +11.23%); no OBV divergence reported |
| Volume vs 20-day average | 10,757,741 vs 12,331,919 (0.87×) | Below average; the 20-day average still contains the September 18 rebalance session |
| Fibonacci swing | $2.35 (Aug 27) → $2.66 (Sep 24) | Up-swing; levels below the price act as retracement support |
| 1× / 2× ATR technical invalidation | $2.545 / $2.48 | 2× sits 4.98% below the last close |
① Price & Moving Averages
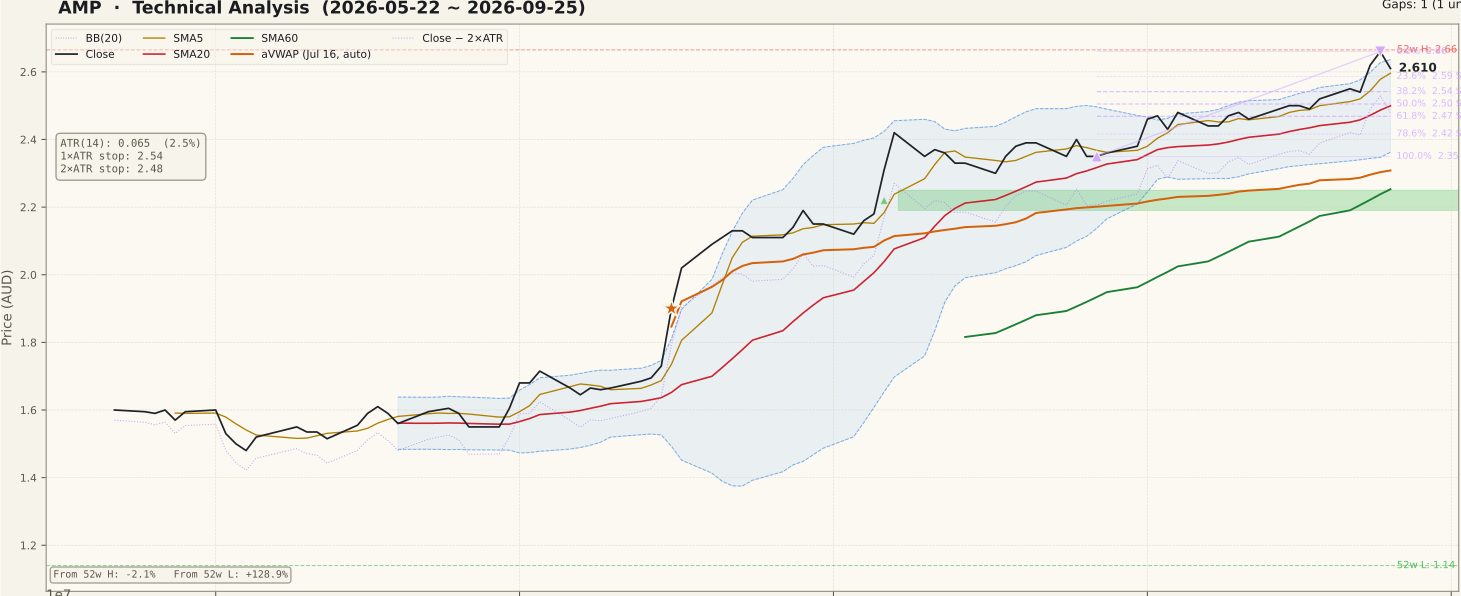
AMP_price-90d-2026-09-27.svgThe close of $2.61 sits above all three averages — SMA5 $2.596 (+0.54%), SMA20 $2.4995 (+4.42%) and SMA60 $2.253 (+15.85%) — and the three are stacked in rising order, an arrangement that has held without a break since June 18. Taken separately, the close has been above SMA20 since June 30 and above SMA60 since mid-April, and SMA20 has been above SMA60 since late April, so the full five-over-twenty-over-sixty stack is the most recent of the three conditions and still roughly seventy-two sessions old.
The week's contribution to that picture is a step up at the top of the band. Tuesday and Wednesday closes lifted the price out of the narrow staircase it had climbed through early September, and Thursday's $2.66 was the highest close of the past twenty sessions — the event the screen recorded as a breakout. Friday's close of $2.61 gave part of that back without reaching SMA5. The upper Bollinger rail at $2.6365 is 1.01% above the close and band width is 10.96% of the middle band, a little wider than the previous week's reading, which is what a push to the upper rail looks like rather than a squeeze.
Overhead, the 52-week high of $2.665 is an intraday extreme from Thursday, 2.11% above the close. Beneath the price, the two-year anchored VWAP from February 12, 2026 is $1.7252 and the 90-day anchor from July 16, 2026 is $2.3084; the close is 51.29% and 13.07% above them, so the average buyer since either anchor sits well below the market. The single unfilled gap on both frames is a support gap at $2.19–$2.25 from August 6, 13.79% below the close at its top — context, not a working level.
② Volume

AMP_volume-90d-2026-09-27.svgFriday traded 10,757,741 shares against a 20-day average of 12,331,919, a ratio of 0.87×. Two adjustments are needed before that number means much. First, the 20-day average still contains Friday September 18, the S&P/ASX September quarterly rebalance trade day, when turnover was lifted right across the market; that single session inflates the denominator, so the 0.87× reads lower than the underlying activity. Second, the market as a whole was quiet this week — the median volume ratio across the screening universe on Friday was about 0.59× — so relative to what a typical ASX stock traded that day, AMP's session was roughly 1.5× the norm rather than below it.
Within the week, the tallest bar belongs to Wednesday September 23, the +3.15% session that lifted the price out of its September range, and Thursday's advance also traded above average. Both were ahead of the market's quiet median. That is supportive participation, but it is not the kind of multi-times-average surge that usually marks an unambiguous breakout, and no specific company catalyst has been identified for those sessions. On the rebalance day itself, AMP rose 1.20% on volume that was roughly in line with the market-wide lift — ordinary for that session, not a stock-specific event.
The fair reading is moderate confirmation: the push to new highs came on above-normal turnover once market conditions are allowed for, Friday's pullback came on lighter turnover, and neither side of the week produced an extreme. A cleaner read arrives once the September 18 session rolls out of the 20-day window in mid-October.
③ MACD

AMP_macd-90d-2026-09-27.svgMACD is 0.0790 against a signal line of 0.0745, a histogram of +0.0045, and the JSON dates the golden cross to September 23, 2026 — three sessions ago. On the panel, that cross ends a stretch of more than a month in which the MACD line drifted beneath its signal from the mid-August peak, with a run of small negative histogram bars through late August and September.
Two points of context keep the cross in proportion. It occurred well above the zero line, so it is a re-acceleration inside an existing uptrend rather than an early-cycle signal. And the histogram is thin — four-and-a-half thousandths of a dollar — so a single weak session can flatten it again. The line is also well below the mid-August peak, which means momentum has re-accelerated from a cooler level rather than returned to its summer pace.
④ RSI

AMP_rsi-90d-2026-09-27.svgRSI(14) is 68.42 on both frames, just beneath the 70 line. On the panel, the oscillator pushed briefly into the overbought band with Thursday's close and eased back under it on Friday, after spending most of September in the mid-to-high 60s.
The divergence fields are null on both timeframes. The previous week's data recorded a bearish RSI divergence between the August 20 and September 18 peaks; that reading no longer appears in this week's JSON, which is consistent with Thursday's new price high being matched by a stronger oscillator reading. That removes one of the cautions from the prior page, but it is not the same as a new positive signal — an RSI near 70 after a three-month advance describes strong momentum that has little room left before it becomes stretched.
⑤ Mansfield Relative Strength

AMP_rs-90d-2026-09-27.svgMansfield RS vs the S&P/ASX 200 is +52.67%, tagged outperform with a rising slope, and it is identical on the two frames as an anchor-free measure should be. A week ago the reading was 47.90 and a month ago 36.52, so the change is +4.77 over the week and +16.14 over the month — both positive from a positive base, which places relative strength in the accelerating quadrant on both horizons.
This is the strongest panel on the page, and it is the reading the screen's rs rank of 97 reflects. The two-year panel shows RS at its highest level in the window. The only caution attached to a reading this high is the obvious one: relative strength at an extreme measures what has already happened, and it tends to flatten before price does when leadership rotates.
⑥ ATR & ADX

AMP_atr_adx-90d-2026-09-27.svgATR(14) is $0.0652, 2.50% of the price. On the panel, average range has eased from its August peak and flattened through September, so the week's push to new highs did not come with a jump in daily range. The 1× ATR technical invalidation reference is $2.545 and the 2× level is $2.48, 4.98% below the close.
ADX(14) is 57.92 on the 90-day frame and 57.77 on the two-year frame — far into the strong-trend band, and it has held near that level since August. ADX measures strength, not direction; paired with rising averages and positive RS it describes a strong uptrend, but readings this high also belong to mature moves, and a turn lower in ADX would be the first sign of the trend losing intensity even while price holds.
⑦ OBV

AMP_obv-90d-2026-09-27.svgOBV is tagged accumulation on both frames — above its MA20 with a rising slope. The gap between OBV and its own MA20 is +21.94% on the 90-day frame and +11.23% on the two-year frame. That figure measures how stretched cumulative flow is relative to its recent average; it is not a divergence reading. The OBV divergence field itself is null on both timeframes, so no OBV divergence is claimed here in either direction.
On the panel, the 90-day line makes a new high with Thursday's session and dips slightly on Friday, tracking price closely — price and flow agree at the right edge. The two-year line is at its highest level in the window as well. The qualification is the same one that applies to relative strength: a line this far above its own average is already extended, and the week's increments were built on moderate, not heavy, turnover.
Bull Case vs Bear Case
Bull Case
- SMA5 > SMA20 > SMA60 in rising order since June 18 (about seventy-two sessions), with the close above all three (+0.54% / +4.42% / +15.85%).
- Thursday's $2.66 was a 20-day-high close, and the September 23 MACD golden cross ended more than a month of the line sitting beneath its signal.
- Mansfield RS +52.67% versus the S&P/ASX 200, accelerating on both the week (+4.77) and the month (+16.14).
- ADX at 57.92 (90d) / 57.77 (2y), deep in the strong-trend band on both frames.
- OBV in accumulation above a rising MA20 on both frames (+21.94% / +11.23%), with no OBV or RSI divergence recorded.
- Close 51.29% above the two-year anchored VWAP ($1.7252) and 13.07% above the 90-day anchor ($2.3084) — little trapped supply overhead.
Bear Case
- Friday gave back 1.88% from the $2.66 breakout close, and the $2.665 52-week high is an intraday extreme not yet exceeded on a closing basis.
- Volume confirmation is moderate: 0.87× the 20-day average on Friday, and the week's advancing sessions were above normal but not a surge.
- The MACD cross is three sessions old with a histogram of only +0.0045, and the MACD line remains well below its mid-August peak.
- RSI at 68.42 after a three-month advance leaves little headroom before the overbought band.
- ADX near 58 and RS near a two-year high are characteristic of a mature move, not an early one.
- No specific catalyst has been identified for the week's push, so the move rests on price and flow alone.
Scenarios
| Scenario | Probability | Path | Trigger / Invalidation |
|---|---|---|---|
| Continuation above the 52-week high | 40% | The price recovers Friday's dip and closes above $2.665, extending the rising stack into a region with no overhead reference on the chart. Accelerating RS and a fresh MACD cross are the configuration most consistent with this path. | Trigger: a daily close above $2.665, ideally on turnover above the market's typical level. Invalidated by a close back beneath SMA20 ($2.4995). |
| Consolidation below the high | 35% | The price works sideways between the $2.64–$2.665 ceiling and the $2.54–$2.50 retracement shelf while SMA20 rises toward it and RSI cools from near 70. The seventy-two-session alignment stays intact. | Trigger: closes that neither clear $2.665 nor fall beneath $2.50. Resolved upward by a close above $2.665, downward by a close beneath $2.4684. |
| Breakout fails and retraces | 25% | Friday's dip extends, the MACD cross reverses before it establishes itself, and the close loses the SMA20 and Bollinger-middle zone near $2.50. The 61.8% and 78.6% retracements at $2.4684 and $2.4163 come into view, with the August 6 support gap at $2.19–$2.25 the deeper reference. | Trigger: a daily close beneath $2.4995 on ordinary or heavier turnover. Technical invalidation of the structure at the 2× ATR level of $2.48. |
Key Levels & Volatility References
| Level | Role | Basis |
|---|---|---|
| $2.665 | Resistance | 52-week high, an intraday extreme from September 24, 2.11% above the close; the 20-day-high close of $2.66 (0% anchor of the current up-swing) sits just beneath |
| $2.64 | Resistance | Upper Bollinger rail ($2.6365), 1.01% above the close; band width 10.96% |
| $2.61 | Current | Last close, September 25, 2026 |
| $2.60 | Support | SMA5 ($2.596), 0.54% below the close; the 23.6% retracement of the August 27 – September 24 up-swing ($2.5868) sits just beneath |
| $2.54 | Support | 1× ATR technical invalidation reference ($2.545) and the 38.2% retracement ($2.5416) together, about 2.5% below the close |
| $2.50 | Support | SMA20 and the Bollinger middle band ($2.4995) with the 50% retracement ($2.505) alongside, about 4% below the close |
| $2.48 | Invalidation | 2× ATR technical invalidation level, 4.98% below the close; the 61.8% retracement at $2.4684 lies just beneath, and the August 27 swing low of $2.35 sits further below |
What to Watch
- Whether a daily close clears $2.665. Thursday reached the level intraday and closed at $2.66; a close above it moves the price into territory with no reference on the two-year chart.
- Whether the September 23 MACD cross holds. With a histogram of +0.0045, one or two soft sessions can undo it; a widening histogram would say the re-acceleration is real.
- Turnover relative to the market, not just to the 20-day average. The average still contains the September 18 rebalance session until mid-October, so comparing AMP's volume with the market's median is the cleaner read for now.
- Whether the $2.50 zone — SMA20, the Bollinger middle band and the 50% retracement stacked together — contains any pullback. A sustained move beneath it would put the rising stack under pressure.
- Company or sector news in financial services. No catalyst was identified for this week's move, and events outside the chart can move the price independently of these panels.