Southern Cross Gold Consolidated
$12.55 −7.58% from the 52-week high of $13.58 · +87.59% from the 52-week low of $6.69
This analysis is based on closing-price data as of September 25, 2026. Whether you're researching Southern Cross Gold Consolidated (SX2) on the ASX or learning how to read stock charts, here are objective support, resistance and technical invalidation levels built from the RSI, MACD and ATR indicators.
The two-year panel is a staircase: a climb from under $4 in early 2025 to the $11–$12 area by the turn of the year, a long and choppy range between roughly $8 and $12 through the first half of 2026, and then a fast advance from the July 17 swing low of $8.07 that has carried the price to a close of $12.55 — 87.59% above the 52-week low of $6.69 and 7.58% under the 52-week high of $13.58, which was printed intraday on September 23. What the screen flagged this week is a pullback inside that advance: after closing at $13.39 on September 23 the price gave back 6.27% in two sessions, and it now sits between a still-rising moving-average stack and a set of momentum readings that have cooled, with MACD crossing beneath its signal line on the basis date itself. The single largest mark on the recent chart — the September 18 session — is part of this structure rather than background to it, and it is discussed plainly below.
Snapshot as of September 25, 2026 close
| Metric | Value | Reading |
|---|---|---|
| Close | $12.55 | 6.27% below the September 23 close of $13.39 after two lower sessions |
| 52-week high / low | $13.58 / $6.69 | 7.58% under the high (set intraday Sep 23); 87.59% above the low |
| SMA5 / SMA20 / SMA60 | $12.95 / $12.41 / $11.08 | Rising order in place since September 11; close under SMA5, above SMA20 and SMA60 |
| Bollinger upper / mid / lower | $13.35 / $12.41 / $11.46 | Close just above the middle band; width 15.29% |
| aVWAP (2y, anchor Sep 19, 2025) | $9.43 | Close 33.06% above |
| aVWAP (90d, anchor Aug 5, 2026) | $12.27 | Close 2.30% above — near the average price paid since August 5 |
| RSI(14) | 53.23 (90d) / 53.21 (2y) | Mid-range; bearish divergence reported on both frames |
| Mansfield RS vs the S&P/ASX 200 | +28.59% | Outperform; tag rising, but below both prior readings (prev week 32.41, prev month 30.04) |
| MACD / signal / histogram | 0.3402 / 0.3560 / −0.0158 | Dead cross dated September 25, 2026 — the basis date |
| ADX(14) | 13.85 (90d) / 13.53 (2y) | Ranging — no directional trend strength |
| ATR(14) | $0.5067 (4.04%) | About 51 cents of average daily range |
| OBV state | 90d accumulation, rising · 2y early accumulation, flat | Above MA20 on both frames (+23.20% / +2.36%); no OBV divergence reported |
| Volume vs 20-day average | 188,218 vs 383,310 (0.49×) | Light; the average itself includes the September 18 session |
| Fibonacci swing | $8.07 (Jul 17) → $12.53 (Aug 20) | Up-swing; retracement levels below the price act as support |
| 1× / 2× ATR technical invalidation | $12.04 / $11.54 | Exact values $12.043 and $11.537; 2× sits 8.07% below the last close |
① Price & Moving Averages
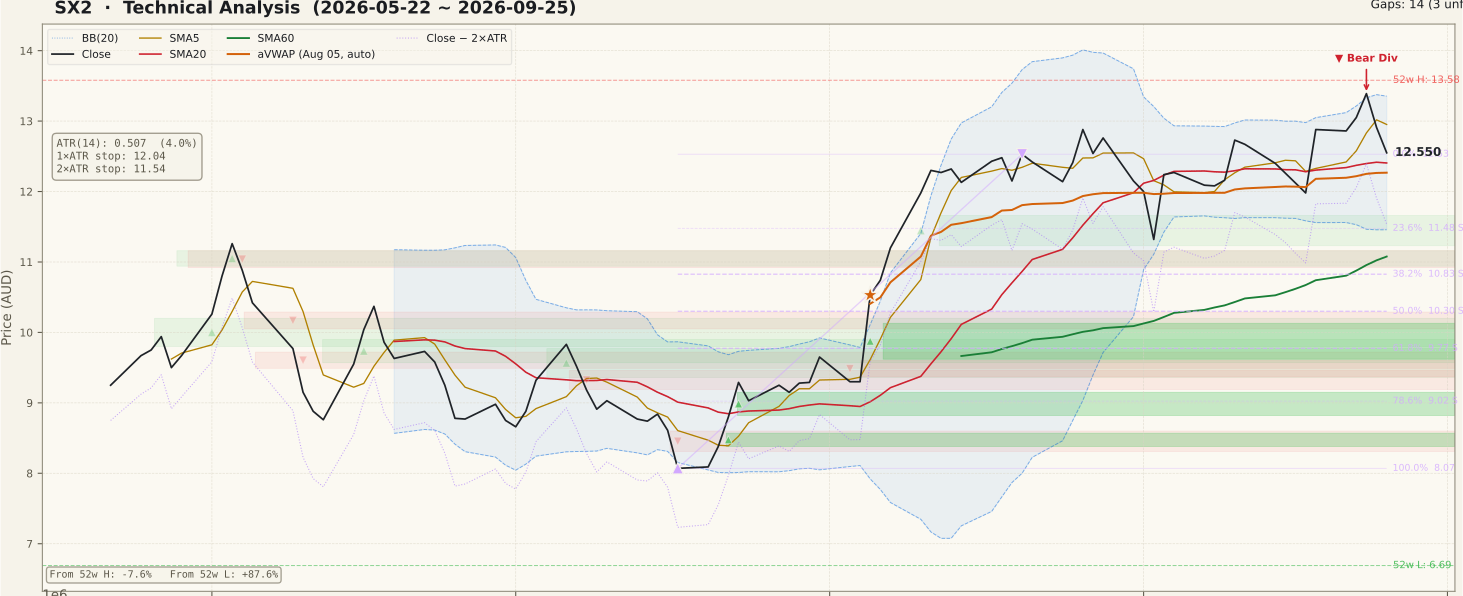
SX2_price-90d-2026-09-27.svgThe averages are in rising order — SMA5 $12.95 above SMA20 $12.41 above SMA60 $11.08 — and that arrangement was established on September 11, a week before the largest session of the quarter. The close of $12.55 sits 3.10% beneath SMA5, 1.16% above SMA20 and 13.30% above SMA60. In plain terms, the two-day retreat has taken the price back through the fastest average and down toward the twenty-day line, which is what a pullback inside a rising stack looks like; it has not yet disturbed the order of the averages themselves.
The September 18 session has to be read as part of this structure, not set aside. In the days before it the close had slipped beneath SMA20 and the five- and twenty-day averages had nearly converged; on September 18 the price rose 7.51% and closed back above SMA20, and the move to the September 23 high followed from there. The rising order dates from before that session, but the price's current position above SMA20 is owed in large part to it. No catalyst for September 18 was identified in public information — the most recent drill results were released on September 3, and the acceptance of a mining-licence application was announced on September 22 — so this page does not attribute a cause to the move.
The swing that anchors the Fibonacci grid runs from the July 17 low of $8.07 to the August 20 high of $12.53, a 55.27% advance. The 0% level of that swing, $12.53, is recorded as resistance in the JSON and the close now sits two cents above it, so the price is effectively at the top of the measured swing rather than inside its retracement zone; the first retracement level, 23.6% at $11.48, lies beneath the 2× ATR invalidation level. The Bollinger middle band coincides with SMA20 at $12.41, the upper rail is $13.35 and the lower rail $11.46, with band width at 15.29%. Anchored VWAP from August 5, 2026 is $12.27 and the two-year anchor from September 19, 2025 is $9.43; the close is 2.30% and 33.06% above them. Three unfilled support gaps sit well below on the 90-day frame — $9.62–$10.13 (August 5), $8.82–$9.15 (July 23) and $8.38–$8.57 (July 22) — with an older one at $6.95–$7.20 from November 2025 on the two-year frame.
② Volume

SX2_volume-90d-2026-09-27.svgThe basis-date session traded 188,218 shares against a 20-day average of 383,310, a ratio of 0.49×. The market as a whole was quiet that day as well — the median volume ratio across the screening universe was 0.59× — so relative to the market the reading is roughly 0.83×, somewhat below ordinary. The whole week from September 21 to September 25 was calm on this measure, with the market median between 0.59× and 0.70× and no price or volume anomaly on SX2 in any of the five sessions. The two-day decline therefore came on light participation; there is no evidence here of heavy distribution, and equally no evidence of heavy support.
The tall bar on the right of the panel is September 18, the S&P/ASX September quarterly rebalance trading day (announced September 4, effective before the open on September 21). Turnover was lifted across the whole market that session — the universe median volume ratio was 2.28× against 0.65×–1.05× on the surrounding sessions. SX2 traded 9.21× its 20-day average; divided by the market median that is still about 4.05×, which makes it a genuine stock-specific outlier rather than a calendar artefact, and it came with the +7.51% price move described above.
That session has one mechanical consequence worth stating. It is inside the current 20-day window, so it inflates the average against which every other bar is compared — part of the reason this week's ratios look low is that the denominator is carrying one unusually large day. The comparison becomes cleaner once September 18 rolls out of the window in mid-October. For a resource company, volume of this kind is also sensitive to drilling and permitting news, which can arrive at any time and sits outside these panels.
③ MACD

SX2_macd-90d-2026-09-27.svgMACD reads 0.3402 against a signal line of 0.3560, a histogram of −0.0158, and the last recorded crossover is a dead cross dated September 25, 2026 — the basis date. The two-year frame agrees closely (0.3394 / 0.3548 / −0.0154). The panel shows a brief upward cross a few sessions earlier during the push to the September 23 high, which the two-day retreat has already reversed.
The broader shape matters more than the latest cross. Both lines peaked in August near the top of the July–August advance and have drifted lower since, even as the price made a higher close in September. That is momentum fading inside a rising price, and it is consistent with the RSI reading on the next panel. The histogram is small — the lines are nearly touching rather than separating — so this is a marginal cross, not a decisive one.
Both lines remain well above zero. The difference between momentum easing and momentum reversing is the zero line, and the chart is a long way from it. On the two-year panel, crosses of this kind high above zero have repeatedly resolved sideways rather than into a trend change, so the fresh dead cross is best read as a caution about pace rather than a verdict on direction.
④ RSI

SX2_rsi-90d-2026-09-27.svgRSI(14) reads 53.23 on the 90-day frame and 53.21 on the two-year frame, in the neutral middle of the range. The JSON reports a bearish divergence on both timeframes and supplies its two peaks: on August 26 the price was $12.88 with RSI at 72.53 (72.21 on the two-year frame), and on September 23 the price was $13.39 with RSI at 65.70 (65.66). The price was 3.96% higher at the second peak while the oscillator was lower — the shape of a regular bearish divergence.
Unlike some divergences, this one has already been followed by a price response: the close is 6.27% below the second peak two sessions later. That is not the same as confirmation. The price is still above SMA20, the averages are still in rising order, and a divergence is a statement about the possibility of a turn rather than proof of one. What would give it more weight is a close back beneath the $12.41 SMA20 and middle-band shelf; what would cancel it is a new high with RSI back above 72.53.
The fall from the mid-60s to 53 in two sessions also removes any overbought reading. RSI last spent time above 70 in August; the September advance never regained that zone, which is simply another way of seeing the divergence. At 53 the oscillator is neither stretched nor washed out — it describes a market that has cooled rather than one under strain.
⑤ Mansfield Relative Strength

SX2_rs-90d-2026-09-27.svgMansfield RS versus the S&P/ASX 200 reads +28.59% and the state is outperform. The prior figures are absolute readings, so the changes have to be worked out explicitly: a week ago RS stood at 32.41, a weekly change of −3.83; a month ago it stood at 30.04, a monthly change of −1.46. Both horizons therefore fall in the positive-but-slowing quadrant — the stock is still ahead of its index, but the lead has narrowed on both views.
The JSON slope tag reads "rising", which is not a contradiction so much as a different measurement: the tag describes the recent trajectory of the line, while the two comparisons are point-to-point. The weekly figure in particular is measured against the September 18 reading, which was lifted by that session's +7.51% move, so part of the weekly decline is the giveback of one outsized day rather than a broad loss of relative ground.
The two-year panel puts +28.59% in context. RS has been above zero for most of the two years, dipped briefly below it in July 2026 at the swing low, and recovered through August into the high 20s and low 30s, where it has stayed. The current reading is solid but well short of the peaks near +80 reached around the turn of the year, so relative strength is supportive of the structure without being exceptional.
⑥ ATR & ADX

SX2_atr_adx-90d-2026-09-27.svgATR(14) is $0.5067, or 4.04% of the last close (two-year frame $0.5070, 4.04%). About 51 cents of average daily range is wide for a stock at this price, and it sets the scale for every level on this page: the distance from the close to SMA20 is under a third of one average session, and the whole band from SMA5 at $12.95 down to the 90-day anchored VWAP at $12.27 is about one and a third sessions. The 1× ATR technical invalidation level is $12.04 ($12.043) and the 2× level is $11.54 ($11.537), 8.07% below the close.
ADX(14) reads 13.85 on the 90-day frame and 13.53 on the two-year frame, below 20 and inside the ranging band. ADX measures strength of direction rather than direction itself, and a low reading alongside rising averages says the price has been advancing in steps with plenty of back-and-forth rather than in a persistent directional run. The panel shows ADX falling from a modest local high in mid-August; the September move did not lift it. That is an honest limit on the bull case: the averages are in trend order, but the trend-strength gauge does not describe a trending market.
⑦ OBV

SX2_obv-90d-2026-09-27.svgThe two timeframes carry different tags. On the 90-day frame OBV is 5,851,472 against an MA20 of 4,749,477, tagged accumulation, above its average with a rising slope. On the two-year frame OBV is 47,812,961 against an MA20 of 46,710,966, tagged early accumulation, above its average but flat. Cumulative flow has improved clearly over the quarter, and only modestly on the longer view.
The distance between OBV and its own MA20 is +23.20% on the 90-day frame and +2.36% on the two-year frame. That figure measures how stretched cumulative flow is relative to its recent average; it is not a divergence. The OBV divergence field is null on both timeframes, so this page makes no OBV divergence claim — a different answer from the RSI panel, which does report a bearish divergence, and the two are left as they stand.
The panel also shows how much of the 90-day reading rests on one day: the September 18 session appears as a single large step up in the line, and the two lower sessions since have taken back only part of it on light volume. The shape is constructive, but the +23.20% stretch leans heavily on that one bar, and it would read as more robust if the line held its level as that session ages.
Bull Case vs Bear Case
Bull Case
- SMA5 > SMA20 > SMA60 in rising order since September 11, established a week before the September 18 session; close still above SMA20 (+1.16%) and SMA60 (+13.30%).
- Mansfield RS +28.59% versus the S&P/ASX 200, in outperform territory with a rising slope tag.
- The two-day retreat came on light volume (0.49×, about 0.83× market-adjusted) — no sign of heavy distribution.
- OBV above its MA20 on both frames — 90d accumulation and rising (+23.20%), 2y early accumulation (+2.36%); no OBV divergence reported.
- Close 33.06% above the two-year anchored VWAP ($9.43) and 2.30% above the 90-day anchor ($12.27); all unfilled gaps lie below the price.
- MACD lines remain well above zero; the dead cross is marginal (histogram −0.0158), and RSI at 53 leaves room in both directions.
Bear Case
- Bearish RSI divergence on both frames: August 26 $12.88 / 72.53 versus September 23 $13.39 / 65.70, already followed by a 6.27% two-day decline.
- MACD dead cross on the basis date (0.3402 vs 0.3560), with both lines drifting lower since their August peak.
- ADX 13.85 / 13.53 — ranging; the rising average stack is not backed by directional trend strength.
- The price's position above SMA20 depends heavily on the September 18 +7.51% session, for which no catalyst was identified.
- Mansfield RS lower than a week ago (−3.83) and a month ago (−1.46) — positive but slowing on both horizons.
- ATR of 4.04% makes the levels loose; the 2× ATR invalidation level is 8.07% away, and resource stocks are exposed to drilling and permitting news outside the chart.
Scenarios
| Scenario | Probability | Path | Trigger / Invalidation |
|---|---|---|---|
| Pullback settles on the SMA20 shelf | 40% | The decline slows around the $12.41 SMA20 and Bollinger middle band, with the $12.27 90-day anchored VWAP just beneath. The price moves sideways between that shelf and SMA5 while the MACD lines re-converge; the rising order of the averages stays intact and the RSI divergence resolves through time. | Trigger: closes holding above $12.27 with SMA20 continuing to rise. Invalidated by a close beneath $12.04 (1× ATR). |
| The September 18 move is retraced | 35% | The divergence and the fresh dead cross lead: the close loses SMA20 and the 90-day anchored VWAP, giving back the September 18 session, and the price moves toward the 1× ATR level at $12.04 and the lower Bollinger rail at $11.46. With ADX ranging, this would return the chart to the sideways pattern of August and early September. | Trigger: a daily close beneath $12.27. Technical invalidation of the structure at the 2× ATR level of $11.54. |
| Retest of the 52-week high | 25% | The pullback is brief, the close recovers SMA5 at $12.95, and the price returns toward the $13.35 upper rail and the $13.58 52-week high. Relative strength would need to turn up on the week for this path to be well supported, and a new high with RSI above 72.53 would cancel the divergence. | Trigger: a daily close above $12.95 on at least average turnover. Invalidated by a close back beneath $12.41. |
Key Levels & Volatility References
| Level | Role | Basis |
|---|---|---|
| $13.58 | Resistance | 52-week high, an intraday extreme on September 23; 8.21% above the close |
| $13.35 | Resistance | Upper Bollinger rail ($13.3537), 6.40% above the close; band width 15.29% |
| $12.95 | Resistance | SMA5 ($12.952), 3.20% above the close — the nearest overhead average after the two-day retreat |
| $12.55 | Current | Last close, September 25, 2026; the 0% swing anchor at $12.53 (August 20 high) sits two cents beneath |
| $12.41 | Support | SMA20 and the Bollinger middle band in the same place ($12.4055), 1.15% below the close |
| $12.27 | Support | 90-day anchored VWAP from August 5, 2026 ($12.2675), 2.25% below the close; the 1× ATR technical invalidation level at $12.04 lies beneath it |
| $11.54 | Invalidation | 2× ATR technical invalidation level ($11.537), 8.07% below the close; the 23.6% retracement at $11.48 and the lower Bollinger rail at $11.46 sit just beneath |
What to Watch
- Whether the pullback finds a floor at the $12.41 SMA20 and middle-band shelf or the $12.27 90-day anchored VWAP just beneath. A close under $12.27 would mean the September 18 session had been fully given back.
- Whether the MACD dead cross widens or reverses. The histogram is only −0.0158, so the cross could be undone quickly; a widening negative histogram is what support for the RSI divergence looks like on this panel.
- Whether the rising order of the averages survives. SMA5 is falling toward SMA20 as the two-day decline feeds into it; a cross of SMA5 beneath SMA20 would end the arrangement that dates from September 11.
- Volume as September 18 rolls out of the 20-day window in mid-October. Until then the average is inflated and ratios understate participation; the cleaner read comes afterwards.
- Company announcements. The mining-licence application acceptance announced September 22 and the September 3 drill results show how often this company reports material news; any further drilling or permitting update can move the price independently of these panels.