Data#3 Limited
$11.10 −6.01% from the 52-week high of $11.81 · +72.90% from the 52-week low of $6.42
This analysis is based on closing-price data as of September 25, 2026. Whether you're researching Data#3 Limited (DTL) on the ASX or learning how to read stock charts, here are objective support, resistance and technical invalidation levels built from the RSI, MACD and ATR indicators.
The two-year panel shows a stock that has twice built a range, lost it, and rebuilt it higher: a slide to the $6s in early 2025, a climb into a $9–$10 plateau through late 2025, a sharp break back toward the 52-week low of $6.42 in March 2026, and then a recovery from April that has carried the close to $11.10 — 72.90% above that low and 6.01% under the 52-week high of $11.81. The defining event of the last quarter is a two-session repricing in late August, from $9.41 on August 21 to $11.73 on August 25, which left an unfilled gap at $9.50–$9.71 behind it. Since then the price has spent a month digesting that move in a band between roughly $10.4 and $11.5, and this week's chart is a pullback-within-uptrend picture: the short averages have re-stacked in rising order above SMA60, MACD has crossed back above its signal line, and Mansfield RS against the S&P/ASX 200 is at +25.28% and still rising. The counterweights are a trend-strength reading that says "range" rather than "trend" (ADX 18.98), a bearish RSI divergence recorded in the JSON, and a final session on light turnover.
Snapshot as of September 25, 2026 close
| Metric | Value | Reading |
|---|---|---|
| Close | $11.10 | 6.01% below the 52-week high; 3.4% below the recent 20-day high |
| 52-week high / low | $11.81 / $6.42 | Upper part of the two-year range |
| SMA5 / SMA20 / SMA60 | $11.19 / $10.8575 / $10.2363 | SMA5 > SMA20 > SMA60 since September 22; close above SMA20 and SMA60, 0.80% under SMA5 |
| Bollinger upper / mid / lower | $11.4374 / $10.8575 / $10.2776 | Close in the upper half of the band; width 10.68% |
| aVWAP (2y, anchor Dec 17, 2024) | $8.2672 | Close 34.27% above |
| aVWAP (90d, anchor Aug 24, 2026) | $10.9638 | Close 1.24% above — the August repricing's average cost is just below |
| RSI(14) | 56.93 (90d) / 56.94 (2y) | Neutral-positive zone; bearish divergence recorded on both frames |
| Mansfield RS vs the S&P/ASX 200 | +25.28% | Outperform, rising (prev week 24.76, prev month 21.60) |
| MACD / signal / histogram | 0.2123 / 0.1892 / 0.0232 | Golden cross dated September 21, 2026; histogram positive |
| ADX(14) | 18.98 (90d) / 18.79 (2y) | Below 20 — the ranging band on both frames |
| ATR(14) | $0.3527 (3.18%) | About 35 cents of average daily range |
| OBV state | 90d accumulation, rising · 2y early accumulation, flat | Above its MA20 on both timeframes; no OBV divergence reported |
| Volume vs 20-day average | 140,218 vs 384,461 (0.365×) | Light final session; the 20-day average includes the September 18 rebalance day |
| Fibonacci swing | $9.41 (Aug 21) → $11.73 (Aug 25) | Up-swing; the close sits between the 23.6% ($11.18) and 38.2% ($10.84) retracements |
| 1× / 2× ATR technical invalidation | $10.75 / $10.40 | Exact values $10.747 and $10.395 (90d; the 2y frame gives $10.394); 2× sits 6.35% below the close |
① Price & Moving Averages
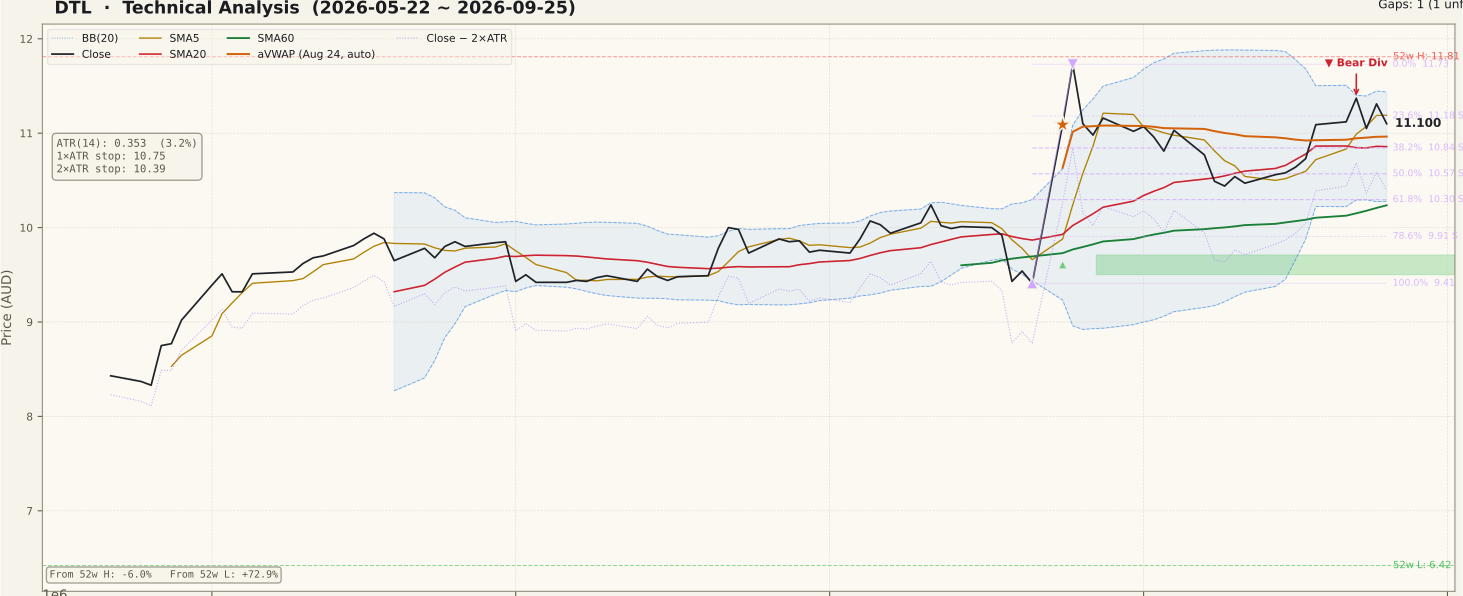
DTL_price-90d-2026-09-27.svgThe averages are in rising order — SMA5 $11.19, SMA20 $10.8575, SMA60 $10.2363 — and the close of $11.10 sits above the two slower lines (+2.23% over SMA20, +8.44% over SMA60) while resting 0.80% beneath SMA5. That arrangement is young: SMA5 moved above SMA20 above SMA60 on September 22, only four sessions before the basis date, and the close has held above SMA20 since September 18 and above SMA60 since August 24. It is a fresh re-stacking after a month of sideways digestion, not a long-established trend structure, and should be read that way.
The context is the late-August repricing. The Fibonacci up-swing runs from $9.41 on August 21 to $11.73 on August 25, a +24.65% move over two sessions that opened the unfilled support gap at $9.50–$9.71 dated August 24. Everything since has been a consolidation of that move: the price has not revisited the swing high, and it has not come near the gap. The close now sits just under the 23.6% retracement at $11.18 and above the 38.2% level at $10.84, which is a shallow retracement by the usual convention — the market has given back relatively little of the August move.
The shorter anchored VWAP, measured from the August 24 session, is $10.9638, only 1.24% below the close: the average price paid since the repricing began is almost exactly where the stock trades now, so that level is the nearest reference for whether recent participants are in profit. The two-year anchor from December 17, 2024 is far lower at $8.2672 (+34.27%). Bollinger band width is 10.68% of the middle band, with the upper rail at $11.4374 (+3.04%) and the lower rail at $10.2776. The last 20-day-high breakout was August 25; the close is 3.4% under the recent 20-day high.
② Volume

DTL_volume-90d-2026-09-27.svgThe final session traded 140,218 shares against a 20-day average of 384,461, a ratio of 0.365×. That is a light session by any reading, and this page makes no claim of heavy participation behind the recent re-stacking of the averages. Across the whole market the week was quiet as well — the median volume ratio across the screening universe ran between about 0.59× and 0.70× from September 21 to 25 — so adjusted for the market Friday's reading is roughly 0.62×: still below ordinary, if less extreme than the raw figure suggests.
The tallest bar in the last month, on September 18, needs to be read carefully. That session was the S&P/ASX September quarterly rebalance trade day, when index-fund flow lifted turnover across the entire market (the universe median ratio was about 2.28× that day). DTL rose 3.36% on about 2.04× its average volume, which is roughly 0.89× once divided by the market median — an ordinary session for this stock, not a stock-specific surge, and Data#3 is not known to be an index-change name in this rebalance. One side effect matters for the current reading: the 20-day average now includes that inflated session, so the denominator behind 0.365× is somewhat high.
The volume that genuinely stands out on the 90-day panel belongs to the late-August repricing, when the two largest bars of the quarter accompanied the move from $9.41 to $11.73. Participation since then has faded to average or below, which is typical of a consolidation but also means the September recovery has not yet been confirmed by expanding turnover.
③ MACD

DTL_macd-90d-2026-09-27.svgMACD stands at 0.2123 against a signal line of 0.1892, with a histogram of +0.0232. The most recent cross was a golden cross on September 21, 2026, which ended a stretch of negative histogram bars through the first half of September as the post-August momentum cooled.
The cross occurred well above the zero line, so it reads as a resumption of positive momentum inside an existing advance rather than an early-stage turn from weakness. The histogram is positive but small, and the MACD line remains beneath its late-August peak — momentum has re-engaged, but it is not yet running at the pace it reached during the repricing itself. A second expansion of the histogram would strengthen the reading; a quick return beneath the signal line would suggest the September recovery is losing traction.
④ RSI

DTL_rsi-90d-2026-09-27.svgRSI(14) is 56.93 on the 90-day frame (56.94 on the two-year frame), comfortably above the 50 midline and well short of the 70 overbought line. That is a neutral-to-positive reading with room in both directions.
The JSON records a bearish RSI divergence on both frames: the first peak on August 5 at a price of $10.07 with RSI 67.09, and the second on September 22 at $11.37 with RSI 65.71. Price made the higher peak while RSI made a slightly lower one. The gap between the two RSI readings is modest — 1.38 points — and a divergence is a possibility of a top, not a confirmed one; it becomes meaningful only if price follows it by losing nearby structure. It does, however, argue against treating the September 22 high as the start of a fresh momentum leg.
⑤ Mansfield Relative Strength

DTL_rs-90d-2026-09-27.svgMansfield RS vs the S&P/ASX 200 is +25.28%, in outperform territory with a rising slope, and identical on the two-year and 90-day frames as expected for this anchor-free measure. Against the prior week's 24.76 it is up 0.52 points, and against the prior month's 21.60 it is up 3.67 points — positive and accelerating on both horizons, though the weekly gain is small.
The two-year panel puts this in context. RS spent much of 2025 below zero, was above zero from September 2025 to February 2026, fell well below zero during the March 2026 break, and has been positive since early June. The current reading sits at the top of that two-year history, and the late-August step up in RS lines up with the price repricing. Relative strength is the clearest positive on the page: whatever the trend-strength panel says, the stock has been doing materially better than the index.
⑥ ATR & ADX

DTL_atr_adx-90d-2026-09-27.svgATR(14) is $0.3527, or 3.18% of price — about 35 cents of average daily range. ATR spiked with the late-August repricing and has been drifting lower through September as the ranges narrowed, which is consistent with a consolidation rather than a trending phase. On that ATR, the 1× reference is $10.747 and the 2× technical invalidation level is $10.395 (the two-year frame gives $10.394), 6.35% below the close.
ADX is 18.98 on the 90-day frame and 18.79 on the two-year frame, beneath 20 on both — the "ranging / weak" band. ADX measures the strength of a trend, not its direction, and here it says the market has not been trending decisively in either direction for weeks. That is the most important caveat to the bullish reading of the averages: an SMA stack formed during a low-ADX month is a structure that has not yet been tested by a directional move.
⑦ OBV

DTL_obv-90d-2026-09-27.svgOn the 90-day frame OBV is in an accumulation state — above its 20-day average and rising, 24.99% above that average. On the two-year frame the state is early accumulation — also above its average (15.46%) but with a flat slope. Both frames agree that the cumulative volume balance sits on the positive side of its trend line.
Both percentages measure how far OBV sits from its own MA20, not a divergence. The JSON records no OBV divergence on either frame, so OBV and RSI are not telling the same story here: RSI shows a bearish divergence, while OBV simply confirms that up-days have carried more volume than down-days. The two-year OBV line is at the top of its history, broadly matching price. Given the light final session, the OBV reading reflects the August volume more than anything recent.
Bull vs Bear
Bull Case
- SMA5 > SMA20 > SMA60 in rising order since September 22; close above SMA20 (+2.23%) and SMA60 (+8.44%)
- MACD golden cross on September 21, well above zero; histogram positive at +0.0232
- Mansfield RS +25.28% vs the S&P/ASX 200, rising on week (+0.52) and month (+3.67), near its two-year high
- Shallow retracement — the close holds between the 23.6% and 38.2% levels of the August swing
- OBV above its MA20 on both frames (90d accumulation, rising; 2y early accumulation); no OBV divergence
- Close above both aVWAPs — 90d $10.9638 (+1.24%) and 2y $8.2672 (+34.27%)
Bear Case
- ADX 18.98 / 18.79 — below 20 on both frames; the market has been ranging, not trending
- Bearish RSI divergence: August 5 $10.07 / 67.09 vs September 22 $11.37 / 65.71
- Final session at 0.365× average volume — the September recovery has no volume expansion behind it
- The moving-average stack is only four sessions old and formed during a low-ADX consolidation
- Price has not revisited the August swing high of $11.73, and the 52-week high of $11.81 is 6.40% above
- Close sits 0.80% under SMA5 and just below the 23.6% retracement at $11.18 — nearest overhead is immediate
Scenarios
| Scenario | Probability | Path | Trigger / Invalidation |
|---|---|---|---|
| Continued range beneath the swing high | 40% | Price keeps rotating between the SMA20 / 38.2% shelf near $10.84–$10.86 and the upper Bollinger rail near $11.44 while ADX stays below 20 | Confirmed by further closes inside $10.84–$11.44; ends on a decisive close outside either edge |
| Resolution higher | 35% | Closes above $11.18 and then the $11.44 upper rail, with ADX rising through 20 and volume above average, open a test of the $11.73 swing high and the $11.81 52-week high | Trigger: daily close above $11.44 on above-average volume; an RSI above 67.09 on a new high would also cancel the divergence |
| Deeper retracement | 25% | Loss of the 90d aVWAP ($10.96) and SMA20 ($10.86) puts the 50% retracement at $10.57 and the 2× ATR level at $10.40 in play, with SMA60 ($10.24) beneath | A close beneath $10.395 (2× ATR) would say the post-August structure has failed rather than paused |
Key Levels & Volatility References
| Price | Role | Basis |
|---|---|---|
| $11.81 | Resistance | 52-week high; the August swing high of $11.73 (Fibonacci 0%) sits just beneath |
| $11.44 | Resistance | Upper Bollinger rail ($11.4374), 3.04% above the close |
| $11.18 | Resistance | 23.6% retracement ($11.1825), with SMA5 $11.19 at the same spot |
| $11.10 | Current | Close, September 25, 2026 |
| $10.96 | Support | 90d anchored VWAP from August 24 ($10.9638), 1.24% below |
| $10.86 | Support | SMA20 and Bollinger mid ($10.8575); 38.2% retracement $10.84 just beneath |
| $10.40 | Invalidation | 2× ATR technical invalidation level ($10.395), 6.35% below; 61.8% retracement $10.30 and SMA60 $10.24 beneath |
What to Watch
- ADX: a move up through 20 would say the consolidation is resolving into a trend; readings stuck below 20 keep the range scenario in front.
- Volume on any close above $11.44 — the September recovery has so far come on light turnover, and a range exit on expanding volume would be the first real confirmation.
- The 90d aVWAP at $10.96 and SMA20 at $10.86: the nearest structure beneath the price and the first place the new stack would be tested.
- RSI on the next high: a reading above 67.09 would cancel the recorded bearish divergence; a new price high on a lower RSI would extend it.
- Mansfield RS holding above its prior-month 21.60 — relative strength has been the steadiest positive and a roll-over would weaken the case.