Flight Centre Travel Group
This analysis is based on closing-price data as of August 14, 2026. Whether you're researching Flight Centre Travel Group (FLT) on the ASX or learning how to read stock charts, here are objective support, resistance and technical invalidation levels built from the RSI, MACD and ATR indicators.
Flight Centre closed Friday at $13.13, four sessions after the August 10 swing high at $13.74 and 4.4% below it — a shallow give-back inside an advance that has carried the stock 17.3% off the July 24 low of $11.71. The two-year chart explains why that pullback is worth watching rather than dismissing: this is a two-year downtrend that ran from the low $20s in late 2024 to a $9.61 low, and the 2026 recovery has only just dragged Mansfield relative strength back above the zero line, to +0.5% versus the S&P/ASX 200. The near-term evidence pulls in two directions. ADX at 34.0 and rising OBV on both timeframes say the advance is a genuine trend with volume flow behind it, while a fresh MACD dead cross on August 13, a close beneath the SMA5 at $13.35, and a Vol/Avg ratio of just 0.51× say the push to $13.74 ran out of participation before it ran out of price.
Snapshot as of August 14, 2026
| Item | Value | Reading |
|---|---|---|
| Close | $13.13 | −20.7% from 52w high · +36.6% from 52w low |
| 52-week range | $9.61 – $16.56 | Roughly the mid-point of the yearly range |
| SMA 5 / 20 / 60 | $13.35 / $12.86 / $12.01 | Close slipped under the SMA5 but holds above a rising SMA20 and SMA60 |
| Bollinger (20) | $14.33 / $12.86 / $11.39 | Band width 22.8% — expanded after the July–August leg; close sits between the mid-band and the upper band |
| aVWAP (2y anchor Oct 18, 2024) | $13.40 | Price 2.0% below — the long-horizon average cost is still overhead |
| aVWAP (90d anchor May 29, 2026) | $12.10 | Price 8.5% above — recent positioning sits onside |
| RSI(14) | 56.7 | Cooled from the ~71 August peak into the neutral band; no divergence detected |
| Mansfield RS (vs the S&P/ASX 200) | +0.5% | Outperforming with a rising slope, but only marginally: −3.11 w/w, +3.33 vs a month ago |
| MACD (12,26,9) | 0.35 / 0.38 / −0.03 | Dead cross Aug 13, 2026 — histogram just turned red, well above the zero line |
| ADX(14) | 34.0 (90d) / 33.5 (2y) | Above 25 — a strong directional reading behind the advance |
| ATR(14) | $0.35 (2.7%) | A contained daily range for a $13 share price |
| OBV (2y / 90d) | accumulation / accumulation | Both above their MA20 and rising: −2.90M vs −4.71M (+38.4%) on 2y, 1.92M vs 0.11M on 90d |
| Volume vs 20d avg | 0.51× | 629,878 shares against a 1,246,753 twenty-day average — the thinnest session of the pullback |
| 1×ATR / 2×ATR technical invalidation | $12.78 / $12.43 | Volatility-based structural reference levels 2.7% and 5.3% below the close |
① Price & Moving Averages
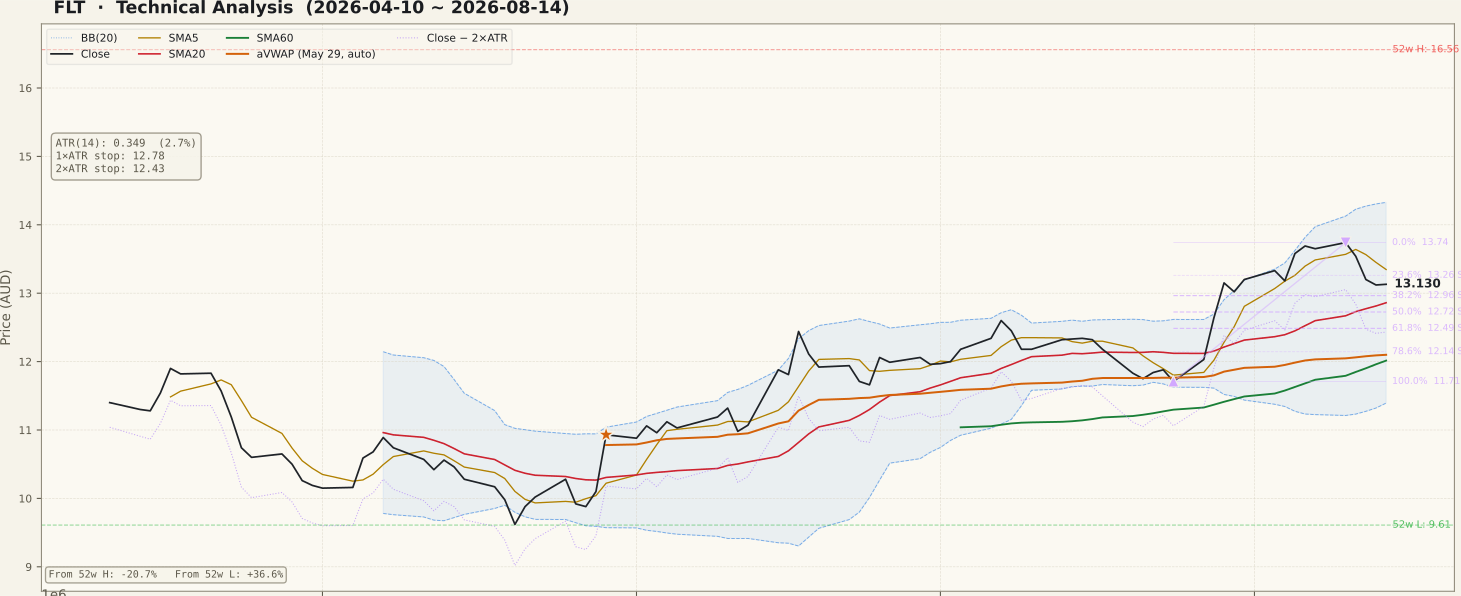
FLT_price-90d-2026-08-16.svgThe 90-day window divides into three acts. April drifted from roughly $11.90 down through $10.20; late May marked the low near $9.70; and from there the stock built a steady, staircase recovery through June and July before accelerating in the first ten sessions of August to the $13.74 high on August 10. What has happened since is a three-session fade to $13.13 — the pullback the screen flagged, and the reason this chart is on the page.
The moving-average structure remains constructive but is no longer pristine. The close sits above a rising SMA20 ($12.86) and SMA60 ($12.01), which is the configuration of an intact advance, but it has slipped beneath the SMA5 at $13.35 — the first time the fast average has been lost since the August leg began. Bollinger band width is 22.8%, wide after the expansion that accompanied the move, with the close roughly mid-band between $14.33 and the $12.86 mean. The Fibonacci grid drawn on the July 24 → August 10 up-swing puts the 23.6% level at $13.26, immediately overhead now that Friday closed below it, with the 38.2% at $12.96 and the 50% at $12.73 as the next mapped references beneath. On the two-year panel the picture is more sobering: the two-year anchored VWAP at $13.40 sits just above the market, and two unfilled gaps from the 2024–25 decline — $16.22–$17.61 dated February 26, 2025, and $19.90–$21.36 dated October 18, 2024 — mark heavy legacy supply above the 52-week high.
② Volume

FLT_volume-90d-2026-08-16.svgFriday traded 629,878 shares against a 20-day average of 1,246,753 — a Vol/Avg ratio of 0.51×, roughly half the recent norm. Read one way that is encouraging: pullbacks on shrinking volume are the classic profile of profit-taking rather than distribution, and none of the three down sessions since August 10 produced an above-average bar. Read the other way it is a caveat that applies to the whole leg, because the advance itself was not built on conviction volume either — the largest bars on the 90-day panel cluster in late May and mid-June, around the low, not around the August highs.
This matters for how much weight the breakout deserves. A stock that runs 17.3% in eleven sessions while daily turnover thins out is being repriced by a narrow bid, not absorbed by a broad one. At roughly $8M of daily turnover at a $13 share price, FLT is liquid enough that the volume and OBV panels can be read at close to face value — this is not the thin-liquidity distortion that makes ASX small-cap volume readings unreliable — so the low participation is a real observation about demand, not a data artefact.
③ MACD

FLT_macd-90d-2026-08-16.svgMACD crossed below its signal line on August 13, 2026, with the line at 0.35, the signal at 0.38 and the histogram marginally negative at −0.03. Two features temper how bearish that reading is. First, the cross occurred well above the zero line, which means it marks a loss of upward momentum inside an existing up-cycle rather than a regime change. Second, the histogram is barely red — a single-hair negative print after a sustained green sequence through late July and early August, not the widening red block that accompanies a genuine rollover.
The honest framing is that MACD has confirmed what price already said: the advance paused. The 90-day panel also shows this is the second dead cross of the recovery — the first, in early July, was followed by a shallow dip and a resumption rather than a reversal, which is a useful precedent but not a guarantee. A histogram that flips back green within a few sessions would neutralise the signal outright; a red sequence that widens while price loses $12.86 would confirm it.
④ RSI

FLT_rsi-90d-2026-08-16.svgRSI(14) reads 56.7 on both timeframes, having peaked around the 70 line during the August run and unwound into the neutral zone over the pullback. The chart flags no divergence, and the JSON carries no divergence peaks, so the momentum reading here is a straightforward one: the stock reached the edge of overbought, cooled without breaking down, and now sits in the band where an advance either reloads or fails.
Fifty-six is a genuinely neutral print, and it is worth resisting the temptation to read it as bullish simply because it is above 50. In a trending advance RSI typically finds its floor in the 40–50 band on pullbacks; a hold above 50 on this dip would be consistent with the trend continuing, while a slide through 40 would say the character of the move has changed. The absence of a bearish divergence is a real positive — the August high was made with momentum confirming, not lagging — but a clean momentum structure is not, by itself, evidence that the next leg is higher.
⑤ Mansfield Relative Strength

FLT_rs-90d-2026-08-16.svgThis is the panel that deserves the closest reading, because the headline and the trajectory disagree. Mansfield RS versus the S&P/ASX 200 stands at +0.5% with a rising slope — technically outperforming. But a week ago the reading was +3.62 and a month ago it was −2.82, which makes the change −3.11 week-over-week and +3.33 month-over-month. Positive and falling week-on-week is the slowing quadrant; positive against a negative month-ago reading is what a fresh zero-line cross looks like. Both are true at once, and the combination describes a stock that has only just clawed level with the index and is already giving some of it back.
The two-year panel makes the fragility plain. Relative strength was pinned below zero for essentially the entire period, spending most of 2025 between −20 and −30, with one brief excursion above zero around the December 2025 – February 2026 rally that promptly failed back into negative territory. The current cross is the second attempt in two years, and it is currently half a point above the line. A sustained move higher would establish leadership; a re-cross below zero would return FLT to the underperforming cohort and remove the relative-strength premise that the screen selected it on. Deeply negative RS history is a standing warning that no other panel on this page cancels.
⑥ ATR & ADX

FLT_atr_adx-90d-2026-08-16.svgATR(14) is $0.35, or 2.7% of price, and it has drifted lower since the June volatility peak — daily ranges have compressed even as price advanced, which is generally the signature of an orderly trend rather than a panic move. That number sizes the structural references on this page: the 1×ATR level sits at $12.78 and the 2×ATR technical invalidation level at $12.43, respectively 2.7% and 5.3% below Friday's close.
ADX is the strongest single input here. At 34.0 on the 90-day panel and 33.5 on the two-year, it is comfortably above the 25 threshold that separates a trend from a range, and it has been climbing since late July. The standard caution applies with force: ADX measures the strength of directional movement, not its direction, so a high reading confirms only that the recent move has been forceful — it would read exactly the same on a decline of equal conviction. Here the price structure supplies the direction, so the fair conclusion is that this advance qualifies as a trend on the measure that matters. What would change that is ADX rolling over from these levels while price trades back under the SMA20, the pattern that marks a trend exhausting rather than pausing.
⑦ OBV

FLT_obv-90d-2026-08-16.svgBoth timeframes read accumulation, above their 20-day averages with rising slopes — the cleanest agreement between the two windows anywhere on this chart. On the 90-day panel OBV sits at 1.92M against a 20-day average of 0.11M; the cumulative line crossed above zero in early August and has continued higher through the pullback, which is the constructive detail. On the two-year panel OBV is at −2.90M against a −4.71M average, a +38.4% divergence above its MA and rising.
The two-year absolute level is the qualifier that keeps this honest. Minus 2.90M means the cumulative volume base destroyed through the 2024–25 decline has not been rebuilt — the line is recovering from a deep hole, not printing new highs alongside price. So the correct reading is "flow is improving on both horizons, from a weak base", which supports the advance without confirming a durable change in ownership. Watching whether the 90-day line keeps making higher highs while price consolidates is the most direct test of whether the August leg was absorbed or simply chased.
Bull Case
- Close $13.13 holds above a rising SMA20 $12.86 and SMA60 $12.01 — the advance structure is intact after a −4.4% give-back.
- ADX 34.0 (90d) / 33.5 (2y), rising since late July — the strongest directional confirmation on this chart in six months.
- OBV accumulation and rising on both timeframes; the 90-day line crossed above zero in early August and kept climbing through the pullback.
- Mansfield RS crossed back above zero to +0.5% vs the S&P/ASX 200, up from −2.82 a month ago (+3.33 m/m).
- Pullback has been orderly — three sessions, no above-average volume bar, RSI unwound to a neutral 56.7 with no divergence flagged.
- Price sits 8.5% above the 90-day aVWAP $12.10, with the July 24 swing low at $11.71 well below.
Bear Case
- MACD dead cross on Aug 13 (0.35 vs 0.38, histogram −0.03) — momentum rolled over at the highs.
- Close lost the SMA5 $13.35 and the 23.6% retracement $13.26 — both now sit overhead as the first references.
- Mansfield RS fell from +3.62 a week ago to +0.51 (−3.11 w/w) — the zero-line cross is half a point from failing, and the December–February attempt already failed once.
- Vol/Avg 0.51× — the August advance ran on thinning participation, with the heaviest 90-day bars back near the May low, not the highs.
- Price is 2.0% below the two-year aVWAP $13.40 — the average cost since the Oct 2024 anchor remains above the market.
- Still 20.7% under the 52-week high $16.56, with unfilled overhead gaps at $16.22–$17.61 and $19.90–$21.36 marking legacy supply from the 2024–25 decline.
Scenarios
| Scenario | Probability | Path | Trigger / Invalidation |
|---|---|---|---|
| Shallow pullback, advance resumes | ~40% | The $12.96–$12.86 support retest zone (38.2% retracement converging with the SMA20 and the Bollinger mid) contains the dip, the MACD histogram flips back green, and price re-tests the $13.74 swing high. The two-year aVWAP at $13.40 is the first real obstacle on that path. | Trigger: a daily close back above $13.35 (SMA5) with the histogram turning positive and volume above the 1.25M average. Invalidated by a close below $12.73. |
| Deeper retracement, then range | ~35% | Price works down into the $12.73–$12.49 band (50–61.8% of the July 24 → August 10 up-swing), where the rising SMA20 catches up from below; Mansfield RS slips back toward zero and the chart settles into a range between roughly $12.50 and $13.74 while ADX unwinds. | Trigger: a daily close below $12.86 (SMA20 / Bollinger mid). Invalidated by a reclaim of $13.26 that holds for more than a session. |
| Zero-line failure | ~25% | Mansfield RS re-crosses below zero, repeating the failed February attempt; price loses the volatility floor, the SMA60 at $12.01 comes into play and the July 24 swing low at $11.71 becomes the next mapped reference. | Trigger: a daily close below the 2×ATR technical invalidation level at $12.43 — that ends the current swing structure. |
Key Levels & Volatility References
| Level | Role | Basis |
|---|---|---|
| $13.74 | Resistance | August 10 swing high — 0% of the Jul 24 → Aug 10 up-swing; the level the current pullback is measured from |
| $13.40 | Resistance | Two-year anchored VWAP (Oct 18, 2024 anchor), with the SMA5 at $13.35 immediately below it |
| $13.26 | Resistance | 23.6% retracement of the up-swing — mapped as support during the advance, now the first reference overhead after Friday closed beneath it |
| $13.13 | Current close | Aug 14 close; 4.4% below the Aug 10 high |
| $12.96 | Support | 38.2% retracement — the nearest defined support, with the SMA20 / Bollinger mid at $12.86 just beneath |
| $12.73 | Support | 50% retracement of the Jul 24 → Aug 10 up-swing |
| $12.43 | Invalidation | 2×ATR technical invalidation level below the Aug 14 close (5.3%); the 61.8% retracement at $12.49 sits just above it and the 1×ATR level is $12.78 |
What to Watch
- Behaviour in the $12.96–$12.86 band — the 38.2% retracement converging with the SMA20 and Bollinger mid. A higher low there keeps the up-swing structure intact; a decisive close beneath it opens the 50–61.8% zone.
- The MACD histogram — whether the August 13 cross stays a one-or-two-bar dip that flips back green, or widens into the red sequence that marked the end of the December–February advance.
- Mansfield RS at the zero line — at +0.5% after a −3.11 week, a re-cross below zero would remove the relative-strength premise entirely and repeat the failed February attempt.
- Volume on any recovery attempt — the whole August leg ran at roughly half the 20-day average. A push through $13.40 and $13.74 without volume expansion would repeat the same non-confirmation.
- Whether the close reclaims the two-year aVWAP at $13.40 — the long-horizon average cost that sits between the market and the August high, and the level that separates a pause from a failure at the highs.