Iress Limited
This analysis is based on closing-price data as of August 14, 2026. Whether you're researching Iress Limited (IRE) on the ASX or learning how to read stock charts, here are objective support, resistance and technical invalidation levels built from the RSI, MACD and ATR indicators.
Iress closed Friday at $7.91, the end of a three-week vertical leg that carried the stock from a $6.32 swing low on July 24 to an $8.02 high on August 13 — and, on the two-year view, 40.2% off the $5.64 low that ended a long decline. The trend readings are about as forceful as this chart gets: a correctly ordered and rising moving-average stack, ADX at 45.3, a MACD golden cross from July 27 still widening, and on-balance volume in accumulation on both timeframes. The tension is the other side of the same coin. RSI at 75.5 is deep in overbought territory, the close sits just under the upper Bollinger Band at $8.06 with band width at 28.02%, and Mansfield relative strength — despite a 13.75-point improvement in a month — is still fractionally below zero at −1.40%, meaning Iress has clawed back ground on the S&P/ASX 200 without yet leading it.
Snapshot as of August 14, 2026
| Item | Value | Reading |
|---|---|---|
| Close | $7.91 | −23.8% from 52w high · +40.2% from 52w low |
| 52-week range | $5.64 – $10.38 | Upper half of the yearly range, but well short of the high |
| SMA 5 / 20 / 60 | $7.76 / $7.07 / $6.47 | Bullish alignment — close above all three, stack rising |
| Bollinger (20) | $8.06 / $7.07 / $6.08 | Band width 28.02%; close pressed against the upper band |
| aVWAP (2y anchor Feb 24, 2025) | $7.83 | Price just above — the long-horizon average cost has finally been reclaimed |
| aVWAP (90d anchor May 27, 2026) | $6.53 | Price far above — the recent base is well underwater relative to the market |
| RSI(14) | 75.5 (90d) / 75.4 (2y) | Overbought; no divergence flagged on either timeframe |
| Mansfield RS (vs the S&P/ASX 200) | −1.40% | Still below zero, but improving fast (+8.55 w/w, +13.75 vs a month ago) |
| MACD (12,26,9) | 0.374 / 0.283 / +0.091 | Golden cross July 27, 2026 — histogram positive and widening above zero |
| ADX(14) | 45.3 (90d) / 44.7 (2y) | Far above 25 — a strong, established directional move |
| ATR(14) | $0.223 (2.8%) | Moderate daily range for a sub-$8 share price |
| OBV (2y / 90d) | accumulation / accumulation | Both above their MA20 and rising; the 2y line is still deeply negative at −19.89M |
| Volume vs 20d avg | 1.60× | 1,460,964 shares against a 915,814 twenty-day average |
| 1×ATR / 2×ATR technical invalidation | $7.69 / $7.46 | Volatility-based structural reference levels below the close |
① Price & Moving Averages
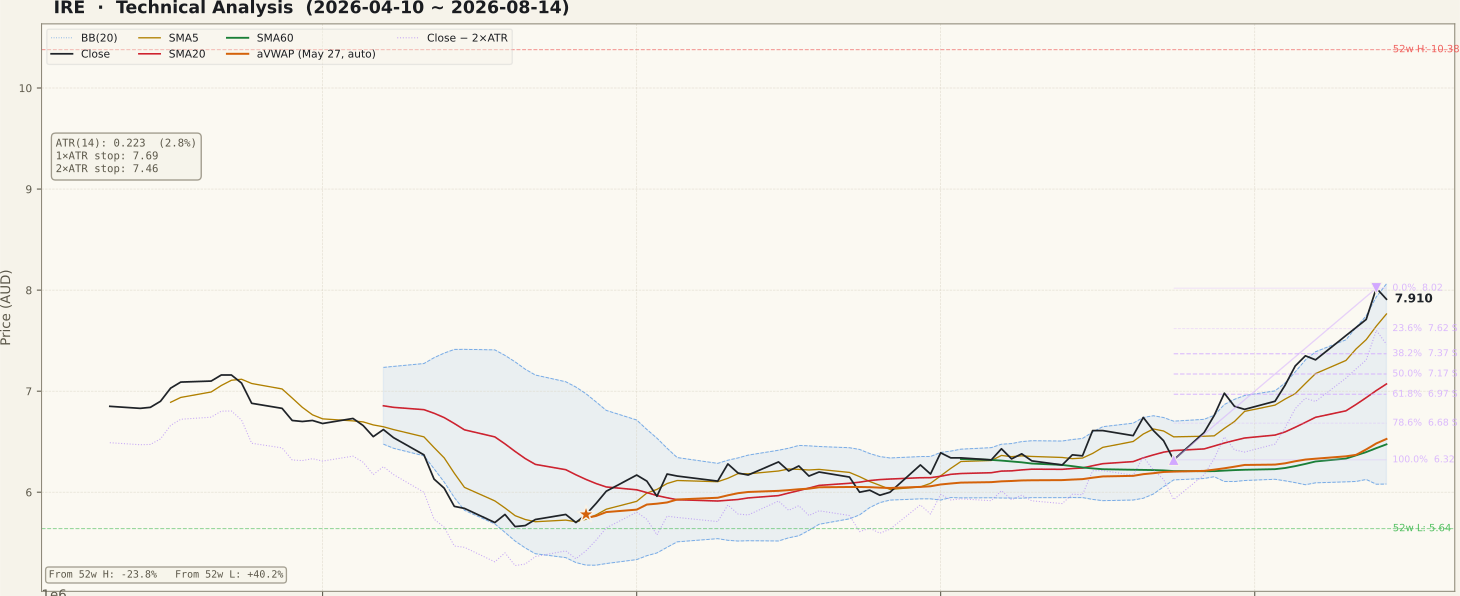
IRE_price-90d-2026-08-16.svgThe two-year chart is a story of one long slide and one sharp repair. Iress traded around the $10 mark in late 2024, ground steadily lower through 2025 with a broad shelf of trade in the high-$8s and $9s, broke down again early in 2026, and bottomed at the $5.64 low that anchors the 52-week range. Everything on the current chart is the recovery from that low — which is why the close at $7.91 is simultaneously 40.2% above the trough and 23.8% below the $10.38 high.
The 90-day window shows the shape more precisely: an April–May drift into the low, a long flat base through June, a slow grind higher in July, and then a near-vertical acceleration in the final three weeks. The moving-average stack is unambiguous — the close sits above a rising SMA5 at $7.76, which sits above the SMA20 at $7.07, which sits above the SMA60 at $6.47. That configuration was inverted for most of the two-year window, so this is a genuine regime change rather than a one-week wobble.
The counterweight is extension. Band width has expanded to 28.02% and the close is pressed against the upper Bollinger Band at $8.06, while the 20-day mean sits nearly a dollar below at $7.07 — the gap between price and its own mean is the widest on this chart. Two structural markers matter here. First, the two-year anchored VWAP at $7.83 (anchor February 24, 2025) has just been reclaimed, so the average cost of the past eighteen months of trade is now beneath the market for the first time in the recovery. Second, the Fibonacci grid drawn on the $6.32 (July 24) to $8.02 (August 13) up-swing puts the first support retest zone at $7.62 (23.6%) and $7.37 (38.2%), with the 50% and 61.8% levels at $7.17 and $6.97 marking where the swing structure itself would come into question.
② Volume

IRE_volume-90d-2026-08-16.svgFriday traded 1,460,964 shares against a 20-day average of 915,814 — a Vol/Avg ratio of 1.60×. The 90-day panel shows why that matters: participation expanded on consecutive sessions into the August 13 high, with the heaviest bars of the past two months arriving on the final push rather than on the earlier base-building. Volume confirming price on the way up is the textbook version of a healthy advance, and this chart has it.
Two qualifications keep the reading honest. Friday's expanded turnover accompanied a close below Thursday's $8.02 high, so at least part of that participation was supply meeting the move rather than pure demand. And the single largest bar in the 90-day window sits back in late May, around the base — that was capitulation-style volume at the low, not part of the current leg.
Liquidity is not a constraint here. Roughly 0.9 million shares a day on average at a $7.91 share price puts Iress well clear of the thin-trading distortions that make volume and OBV unreliable in ASX small caps, so both panels on this page can be read closer to face value than is usual on this site.
③ MACD

IRE_macd-90d-2026-08-16.svgMACD crossed above its signal line on July 27, 2026, and the separation has widened every week since: the line reads 0.374, the signal 0.283, and the histogram is positive at +0.091. Both the line and the histogram are at their highest levels of the 90-day window, and on the two-year panel the MACD line is at the top of its two-year range — momentum is not merely positive, it is unusually strong by this stock's own historical standard.
The cross itself formed just above the zero line after an extended period of sub-zero readings through the April–June base, which is the constructive variety: it marks the handover from repair to trend rather than a late-cycle re-acceleration. The honest caveat is that readings at the top of a two-year range are, by definition, hard to extend. The first warning would be a histogram that peaks and contracts over several sessions while price stalls beneath $8.02 — momentum fading ahead of price is the standard early tell.
④ RSI

IRE_rsi-90d-2026-08-16.svgRSI(14) reads 75.5 on the 90-day panel and 75.4 on the two-year — comfortably above the 70 overbought threshold, and the highest reading on the two-year chart. Importantly, no divergence is flagged on either timeframe: momentum has been making higher highs alongside price, which is confirmation rather than warning. This is the panel most likely to be misread by newer chart readers.
Overbought is a description of speed, not a verdict on direction. With ADX at 45, this is precisely the regime in which RSI can sit in the 70–80 band for weeks — strong trends routinely stay overbought, and calling a top purely because an oscillator is high is one of the most reliable ways to be early and wrong. What it does say is that the move is stretched relative to its own recent range, so the risk of a sharp mean-reverting session is elevated.
The reading that would change the picture is a divergence forming: a higher price high above $8.02 accompanied by an RSI peak below 75.5. Until that shape appears — and until price confirms it by breaking structure — an overbought RSI in a 45-ADX trend is a caution flag, not a reversal signal.
⑤ Mansfield Relative Strength

IRE_rs-90d-2026-08-16.svgThis is the most nuanced panel on the page. Mansfield RS versus the S&P/ASX 200 stands at −1.40% with a rising slope. A week ago it was −9.94 and a month ago −15.15, so the change is +8.55 week-over-week and +13.75 month-over-month — a very steep rate of improvement. Because the reading is still in negative territory, the correct label is improving, not accelerating: the line is travelling toward zero from below, and the distinction matters.
The common error here is to see a steeply rising RS line and call it leadership. It is not — not yet. A negative Mansfield reading means that over the measurement window Iress has still underperformed the index; what has changed is the direction of that gap, and the gap is now within a whisker of closing. The two-year panel frames it properly: RS was positive in late 2024, spent the whole of 2025 and the first half of 2026 below zero, reached roughly −28 at the worst of it, and has spent the past six weeks retracing that entire hole.
A cross above zero — which is only 1.40 points away — would be the single most consequential change available on this chart, because it turns a strong-looking absolute chart into a genuine relative-strength chart. A stall just beneath zero, on the other hand, would say the advance was a beta-driven catch-up rather than the start of outperformance.
⑥ ATR & ADX

IRE_atr_adx-90d-2026-08-16.svgATR(14) is $0.223, or 2.8% of price — moderate in absolute terms, but the 90-day panel shows it turning sharply higher in the last few sessions as the advance steepened. This is the number that sizes the structural references on this page: the 1×ATR level sits at $7.69 and the 2×ATR technical invalidation level at $7.46, both measured from Friday's close. The invalidation level is 5.6% below the market, which is a relatively tight band — and it will widen if ATR keeps expanding.
ADX is the headline reading: 45.3 on the 90-day panel and 44.7 on the two-year, far above the 25 line that defines a strong trend. ADX measures strength, not direction, so this simply confirms that the move off the June base has been forceful and persistent rather than choppy. It is also worth noting that readings above 40 are historically the top decile for most charts, and that they usually resolve through a pause or consolidation rather than by climbing indefinitely — a high ADX describes what has happened, not what comes next.
⑦ OBV

IRE_obv-90d-2026-08-16.svgBoth timeframes read accumulation with a rising slope, but they describe different things. On the 90-day window OBV sits at 2.86M against a 20-day average of −935,360 — the cumulative line has flipped from negative to positive within the last few sessions, which is the cleanest flow signal on this page. The headline divergence figure of 405.52% above its MA20 should be treated with care: the denominator is a near-zero average, so the percentage is arithmetically inflated. The meaningful fact is the sign change, not the size of the number.
The two-year window is the sober counterpart. OBV there is at −19.89M against a −23.68M average, a +16.02% divergence — above its MA and rising, but the absolute line remains deeply negative. Years of net distribution built during the 2025 decline have not been repaired by six weeks of accumulation, and that is visible as a large gap between the current OBV level and where it stood at the start of the two-year window.
Read together: near-term flow confirms the advance, long-term flow does not yet corroborate a completed base. That is a reasonable state of affairs for a stock six weeks into a recovery, but it is the reason this chart is best described as an early-stage repair rather than a mature uptrend.
Bull Case
- Full bullish alignment: close $7.91 above a rising SMA5 $7.76 > SMA20 $7.07 > SMA60 $6.47.
- ADX 45.3 (90d) and 44.7 (2y) — a strong, established directional move, not a choppy bounce.
- MACD golden cross July 27 with the line 0.374 over signal 0.283 and the histogram widening at +0.091, both at 90-day highs.
- Mansfield RS repaired from −15.15 a month ago and −9.94 a week ago to −1.40% — within 1.40 points of the zero line.
- The advance carried 1.60× average volume (1,460,964 vs 915,814), with the heaviest bars of the past two months on the final push.
- Price has reclaimed the two-year anchored VWAP at $7.83 and sits far above the 90-day aVWAP at $6.53; OBV is in accumulation on both timeframes and has flipped positive on the 90-day.
Bear Case
- RSI 75.5 — the highest reading on the two-year chart, after a run from $6.32 to $8.02 in three weeks.
- Close pressed against the upper Bollinger Band at $8.06 with band width at 28.02% — stretched, with volatility expanding.
- Mansfield RS is still negative at −1.40%: the improvement is real, but Iress has not yet outperformed the S&P/ASX 200 over the measurement window.
- Friday closed at $7.91, below Thursday's $8.02 high, on expanded volume — the first session where supply visibly met the advance.
- The two-year chart shows a broad shelf of 2025 trade immediately overhead — untested overhead supply that the advance is now entering, and the close is still 23.8% under the $10.38 high.
- The 90-day OBV divergence of +405.52% is inflated by a near-zero MA20 baseline (−935,360); the two-year line remains deeply negative at −19.89M, so multi-year flow has not been repaired.
Scenarios
| Scenario | Probability | Path | Trigger / Invalidation |
|---|---|---|---|
| Trend extends | ~40% | Price clears the $8.02 swing high and walks the upper Bollinger Band higher, with Mansfield RS crossing above zero and confirming leadership. The two-year chart shows no unfilled gaps overhead, so the next references are the 2025 trading shelf and, further out, the $10.38 52-week high. | Trigger: daily close above $8.02 on ≥1.5× average volume, with RSI making a new high above 75.5. Invalidated by a close back below $7.62. |
| Digest, then resume | ~35% | The stretched close mean-reverts into the $7.83–$7.37 support retest zone (the two-year aVWAP, the SMA5 at $7.76 and the 23.6–38.2% retracements of the $6.32 → $8.02 up-swing), the SMA20 at $7.07 catches up, a higher low forms and $8.02 is challenged again from a less extended base. | Trigger: a fade from $8.02 on contracting volume with the MACD histogram narrowing. Invalidated by a close below the 61.8% retracement at $6.97. |
| Momentum unwinds | ~25% | The $8.02 high marks the end of the thrust: price loses the two-year aVWAP at $7.83, RSI breaks back under 70, and the retracement extends through the 50% and 61.8% levels at $7.17 and $6.97 toward the SMA60 at $6.47. Mansfield RS stalls just beneath zero, marking the advance as catch-up rather than leadership. | Trigger: daily close below the 2×ATR technical invalidation level at $7.46 — that ends the current swing structure. |
Key Levels & Volatility References
| Level | Role | Basis |
|---|---|---|
| $8.06 | Resistance | Upper Bollinger Band (20, 2σ); band width 28.02% |
| $8.02 | Resistance | August 13 swing high — 0% of the $6.32 → $8.02 up-swing |
| $7.91 | Current close | August 14 close |
| $7.83 | Support | Two-year anchored VWAP (anchor Feb 24, 2025) — reclaimed this week |
| $7.76 | Support | SMA5, rising steeply beneath the close |
| $7.62 | Support | 23.6% retracement of the $6.32 → $8.02 up-swing; the 1×ATR reference sits just above at $7.69 |
| $7.46 | Invalidation | 2×ATR technical invalidation level below the August 14 close (5.6%); the 38.2% retracement at $7.37 sits just beneath |
What to Watch
- A daily close above $8.02 on at least 1.5× average volume — the confirmation that turns a three-week thrust into a continuation.
- Whether Mansfield RS crosses above zero from −1.40% — the single most consequential change on this chart, since it converts a strong absolute trend into genuine outperformance versus the S&P/ASX 200.
- Behaviour on the first pullback into $7.83–$7.62 — a higher low against the two-year aVWAP and the 23.6% retracement keeps the up-swing structure intact; losing $6.97 (61.8%) breaks it.
- Whether an RSI divergence forms: a price high above $8.02 with a momentum peak below 75.5 would be the first genuine warning from this panel.
- Whether 90-day OBV keeps printing higher highs now that it has flipped positive, and whether the two-year line makes progress on its −19.89M deficit.