Austal
This analysis is based on closing-price data as of August 14, 2026. Whether you're researching Austal (ASB) on the ASX or learning how to read stock charts, here are objective support, resistance and technical invalidation levels built from the RSI, MACD and ATR indicators.
Austal closed the week at $4.36 — 50.6% below its 52-week high of $8.82, but 30.9% above the $3.33 low. The two-year chart traces a long advance from the $2.25–$2.31 gap area of September 2024 to a peak of $8.76 on January 14, 2026, then a decline that ran the whole way into that $3.33 low and left Mansfield relative strength versus the S&P/ASX 200 at −27.0%. What has changed is recent and highly concentrated: after two sessions in which the price series records no traded volume at all and an unchanged $3.84 close, price gapped up to $4.00 on August 11, reached a $4.51 swing high the same session, and has since eased back to $4.36 on turnover running at 1.97× the 20-day average. The result is an event-driven repricing sitting on top of a structure that remains broken above $5 — a genuine change of momentum inside a downtrend, not a repaired chart.
Snapshot as of August 14, 2026
| Item | Value | Reading |
|---|---|---|
| Close | $4.36 | −50.6% from 52w high · +30.9% from 52w low |
| 52-week range | $3.33 – $8.82 | Lower quarter of the range despite the August advance |
| SMA 5 / 20 / 60 | $4.25 / $3.82 / $3.95 | Close above all three, but the SMA20 is still below the SMA60 — the stack has not aligned |
| Bollinger (20) | $4.44 / $3.82 / $3.21 | Band width 32.29% — expansion, not compression; price pressed to the upper band |
| aVWAP (2y anchor Feb 13, 2026) | $4.44 | Price marginally below — the average holder since the February breakdown is not yet onside |
| aVWAP (90d anchor Jun 29, 2026) | $3.98 | Price above — positioning since late June is onside |
| RSI(14) | 62.4 | Firmly positive, below overbought; no divergence recorded on either timeframe |
| Mansfield RS (vs the S&P/ASX 200) | −27.0% | Underperforming, but +9.81 on the week and +15.66 on the month — improving from a deep hole |
| MACD (12,26,9) | 0.112 / 0.021 / +0.091 | Golden cross Jul 24, 2026; both lines above zero with the histogram widening |
| ADX(14) | 22.1 (2y) / 22.4 (90d) | Emerging — above 20, below 25; no established trend yet |
| ATR(14) | $0.257 (5.90%) | High — a wide daily range that makes every volatility-derived level distant |
| OBV (2y / 90d) | early accumulation / accumulation | Both above MA20; 2y flat with +10.94% divergence, 90d rising with +236.4% |
| Volume vs 20d avg | 1.97× | 4,993,060 shares against a 2,541,418 average — the week traded on event turnover |
| Unfilled gaps | $4.00–$3.84 · $2.31–$2.25 | Aug 11, 2026 support gap directly beneath the close; Sep 16, 2024 gap far below |
| 1×ATR / 2×ATR technical invalidation | $4.10 / $3.85 | Volatility-based structural reference levels below the close |
① Price & Moving Averages
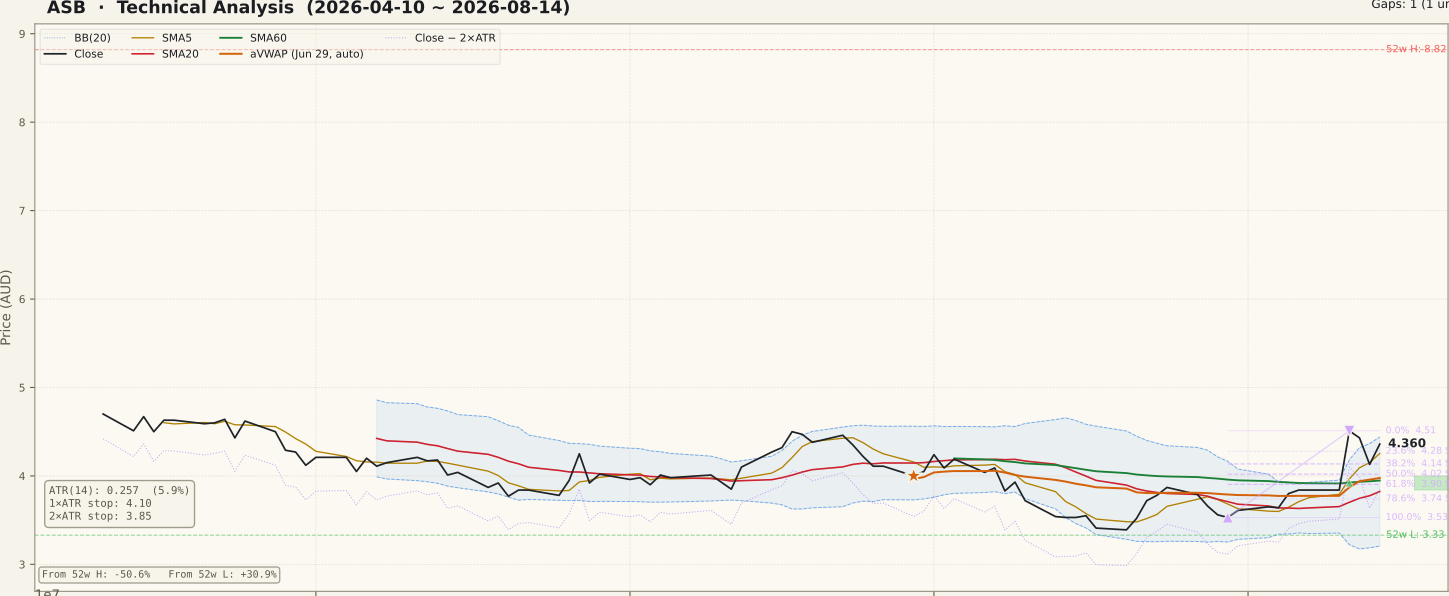
ASB_price-90d-2026-08-16.svgThe close at $4.36 now sits above all three tracked averages — SMA5 $4.25, SMA20 $3.82 and SMA60 $3.95 — a configuration that was absent through most of the post-February decline. The qualification matters as much as the fact: the SMA20 is still below the SMA60, so the stack has not yet aligned in the classic bullish order. That is what a chart looks like eight sessions after a vertical move out of a base rather than after a sustained trend; the 20-day line is dragging the late-July lows and needs several more sessions of higher prices before it clears the 60-day.
Bollinger Bands frame the range at $3.21–$4.44 around a $3.82 mid, with band width at 32.29%. This is expansion, not compression — the bands are opening after the August move, and price is riding the upper edge. The anchored VWAPs split cleanly around the close: the 90-day aVWAP of $3.98 (anchored June 29, 2026) sits well below price, while the two-year aVWAP of $4.44 (anchored February 13, 2026) is fractionally above it. That $4.44 line coincides almost exactly with the upper Bollinger Band at $4.44, making it a genuine double ceiling. Beneath the close, the 90-day retracement grid of the July 30 ($3.53) to August 11 ($4.51) up-swing gives 23.6% at $4.28, 38.2% at $4.14 and 50% at $4.02, with the unfilled $4.00–$3.84 gap immediately below the 50% line. The two-year retracement grid is anchored to a different swing entirely — January 14 ($8.76) down to February 6 ($5.73) — and price has since traded through the $5.73 anchor, so those levels from $6.45 to $8.76 are structurally real but nowhere near the market.
② Volume

ASB_volume-90d-2026-08-16.svgFriday traded 4,993,060 shares against a 20-day average of 2,541,418 — a Vol/Avg ratio of 1.97×. The 90-day panel makes the shape obvious: the two tallest bars of the entire window are the August 11 and 12 sessions, both flagged as 2× spikes, with the following two sessions still well above the running average. This is not a single unconfirmed bar, but neither is it ordinary two-way trade.
Two features deserve care. First, the two sessions immediately before the gap recorded no traded volume at all with an unchanged $3.84 close — the signature of a trading halt, a routine ASX mechanism that typically runs two trading days around an announcement. The gap on the chart is therefore structural, not a data error. Second, the 20-day average is now being pulled upward by the event bars themselves, which means the 1.97× ratio actually understates how extreme the August 11 session was against the pre-halt baseline of roughly 1.5 million shares visible on the panel. Volume of this shape confirms that the move was real; it does not tell you the move was organic.
③ MACD

ASB_macd-90d-2026-08-16.svgMACD crossed above its signal line on July 24, 2026, well before the August gap, and the spread has widened sharply since: MACD 0.112 against a signal of 0.021, with a histogram of +0.091. On the 90-day panel that is the widest positive histogram of the window, and both lines have now pushed above the zero line after spending most of the period beneath it. Read on its own, this is the most constructive momentum reading on the page.
The caution is mechanical. MACD is an average of averages, so a single gap session lifts it regardless of what follows — the cross itself dates from July, but the magnitude belongs almost entirely to August 11 and 12. A histogram that stays wide while price consolidates above $4.28 would mean the momentum is being carried forward; a histogram that contracts while price stalls beneath the $4.44 ceiling is the first evidence that the impulse is spending itself and the indicator is simply catching up to a completed move.
④ RSI

ASB_rsi-90d-2026-08-16.svgThe RSI reads 62.4 on both the two-year and 90-day frames — positive, clear of the 50 pivot, and short of the 70 overbought threshold. No divergence is recorded on either timeframe and no divergence peaks are supplied, so there is nothing here to read as exhaustion; inventing peaks from the shape of the line is exactly the error this indicator invites.
The 90-day panel does show the sequence plainly: the oscillator sat in the low 30s through the July base, vaulted just past 70 in the gap sessions, then eased back to the low 60s as price handed back part of the advance. The two-year panel puts that in perspective — the RSI has spent almost all of 2026 between 30 and 55, so a reading of 62.4 is genuinely unusual for this stock's recent history. That is a change of character worth noting, but a momentum peak that has already passed is a weaker signal than one still building, and an RSI spike out of a multi-month range confirms nothing about what happens next on its own.
⑤ Mansfield Relative Strength

ASB_rs-90d-2026-08-16.svgMansfield RS versus the S&P/ASX 200 stands at −27.0%, tagged underperform with a rising slope. The direction is emphatic: a month ago the reading was −42.7% and a week ago −36.8%, so the line has closed 15.7 points in a month and 9.8 points in the last week alone. In negative territory a positive change is improvement — movement back toward zero — not a mere slowing of decline, and this is the sharpest such improvement since relative strength collapsed through zero in February 2026.
The level is the other half of the story, and it is unflattering. At −27.0% the stock has still badly lagged the index, and the two-year panel shows why the distinction matters: RS was positive and often above +50 from late 2024 through January 2026, then fell vertically in February and has ground between roughly −25 and −42 ever since. One week of improvement out of that hole is not leadership. Deeply negative relative strength is a standing caution even when price structure and momentum both read constructively, because index capital tends to concentrate in names already outperforming — and by that measure Austal has not yet earned its way back.
⑥ ATR & ADX

ASB_atr_adx-90d-2026-08-16.svgATR(14) is $0.257, or 5.90% of price — a high reading in absolute terms and one that has roughly doubled from the pre-gap level visible on the 90-day panel. That figure sizes every volatility-derived reference on this page: 1×ATR below the close sits at $4.10 and the 2×ATR technical invalidation level at $3.85, which is 11.8% beneath the close. A structure this wide is the direct cost of the event that created the move, and it is the single most important practical fact on the chart.
ADX(14) at 22.1 on the two-year frame and 22.4 on the 90-day frame is classified as emerging — above the 20 threshold that separates a range from a developing trend, but below the 25 that marks an established one. ADX measures strength, not direction, and it responds to sustained directional movement rather than to a single bar, so it has not yet registered the August advance in full. There is a useful convergence to note: the $3.85 invalidation level falls inside the unfilled $4.00–$3.84 gap, meaning a complete gap fill and the volatility-derived line are effectively the same event rather than two separate ones.
⑦ OBV

ASB_obv-90d-2026-08-16.svgBoth timeframes point the same way, with different intensity. The 90-day window reads accumulation: OBV above its 20-day average, slope rising, divergence +236.4%. The two-year window reads early accumulation: above the MA20, but with a flat slope and a much milder +10.94% divergence. Flow turned up alongside price and ratifies the August sessions, which is more than many post-gap charts can show.
The 236.4% figure deserves a caveat rather than applause. The 90-day OBV baseline is close to zero — a value of 5,495,984 against an MA20 of 1,633,743 — so a small denominator produces a spectacular-looking percentage. The direction is what matters there, not the magnitude. The two-year line is the more sober measure: it has only just crossed back above its own average after months of erosion through the February-to-July decline, and its slope is still flat. A single week of event volume does not rebuild a year of distribution, and the constructive continuation to look for is the two-year OBV slope turning up while price holds above the $4.28 shelf.
Bull Case
- Close $4.36 above SMA5 $4.25, SMA20 $3.82 and SMA60 $3.95 — a configuration absent through most of the post-February decline.
- Mansfield RS has improved 15.66 points in a month (−42.7% → −27.0%) and 9.81 points in the last week, with the JSON slope tag reading rising.
- MACD golden cross of Jul 24, 2026 with both lines above zero and the histogram at +0.091 — the widest positive reading of the 90-day window.
- OBV above its MA20 on both timeframes; the 90-day state is accumulation with a rising slope.
- The unfilled Aug 11 gap at $4.00–$3.84 sits directly beneath as a support shelf, with the 50% retracement at $4.02 just above its upper edge.
- Volume ratification: 1.97× the 20-day average on the latest session, following four consecutive above-average sessions rather than one isolated bar.
Bear Case
- Mansfield RS is still −27.0% versus the S&P/ASX 200 — a rising line out of a deep hole is improvement, not leadership.
- Price remains 50.6% below the $8.82 52-week high, and the entire two-year retracement grid from $6.45 to $8.76 is untested overhead.
- The advance began with two zero-volume sessions and a gap open, not with a chart-built base; the driver is not identifiable from price data.
- ATR at 5.90% of price puts the 2×ATR technical invalidation level 11.8% below the close — an unusually wide structure to respect.
- ADX 22.1 / 22.4 is emerging, still short of 25, and price has already handed back part of the move from the $4.51 high to $4.36.
- SMA20 $3.82 is still below SMA60 $3.95 — the stack has not aligned — while the two-year aVWAP at $4.44 caps the close from just above.
Scenarios
| Scenario | Probability | Path | Trigger / Invalidation |
|---|---|---|---|
| Post-event consolidation | ~45% | Price ranges between the $4.28 and $4.14 retracements and the $4.44 ceiling while volume normalises, the SMA20 catches up to the SMA60, and ADX works through 25 as the structure digests the August move. | Trigger: a daily close above $4.51 on above-average volume. Invalidated by a daily close below $4.02. |
| Gap fill | ~35% | The momentum impulse fades, price works down through the 38.2% level at $4.14 and the 50% level at $4.02 into the $4.00–$3.84 window; a complete fill lands on the $3.85 2×ATR technical invalidation level. | Trigger: a daily close below $4.02. Invalidated by a reclaim of the $4.44 aVWAP and upper-band confluence. |
| Spike unwinds into the base | ~20% | The August repricing is given back in full, the $3.85 level gives way, and price returns toward the SMA20 at $3.82 and the $3.53 late-July base with relative strength rolling back toward −40%. | Trigger: a daily close below the 2×ATR technical invalidation level at $3.85 — that ends the August swing structure. |
Key Levels & Volatility References
| Level | Role | Basis |
|---|---|---|
| $4.51 | Resistance | Aug 11, 2026 swing high; 0% anchor of the 90-day up-swing |
| $4.44 | Resistance | Upper Bollinger Band (20, 2σ) converging with the two-year aVWAP anchored Feb 13, 2026 |
| $4.36 | Current close | Aug 14, 2026 close, above the SMA5 at $4.25 |
| $4.28 | Support | 23.6% retracement of the Jul 30 – Aug 11 up-swing — the first shelf beneath the close |
| $4.14 | Support | 38.2% retracement; the 1×ATR reference sits just under at $4.10 |
| $4.02 | Support | 50% retracement, immediately above the upper edge of the unfilled $4.00–$3.84 gap |
| $3.85 | Invalidation | 2×ATR technical invalidation level, 11.8% below the close, falling inside the Aug 11 gap |
What to Watch
- Whether the unfilled $4.00–$3.84 gap survives — a complete fill lands on the $3.85 2×ATR technical invalidation level, so those two references resolve together rather than separately.
- Volume normalisation: whether the 1.97× ratio decays toward 1.0 with price above $4.28, or whether the event bars are followed by heavy down-sessions — the difference between digestion and unwinding.
- Mansfield RS versus the S&P/ASX 200: −27.0% now, +9.81 on the week. Continued closing of the gap to the index turns a one-week jump into a trend; a stall here leaves the stock a laggard whatever price does.
- ADX rising through 25 while price stays above the $4.44 aVWAP and upper-band confluence — the evidence that August became a trend rather than an event.
- The MACD histogram: contraction from +0.091 while price stalls beneath $4.51 is the first sign the momentum impulse is fading, and the two-year OBV slope turning up would be the counter-evidence.