Santos
This analysis is based on closing-price data as of October 23, 2026. Whether you're researching Santos (STO) on the ASX or learning how to read stock charts, here are objective support, resistance and technical invalidation levels built from the RSI, MACD and ATR indicators.
Over two years Santos has moved from a 2025 base in the $5.90–$6.50 area into a rising structure that has carried price to within 3.3% of its 52-week high, with the 2-year anchored VWAP ($7.41) and the 60-day average ($8.44) both well below the close. The short-term picture is a pullback inside that uptrend: after closing at a swing high of $9.32 on October 19, the stock gave back ground in the last two sessions to $9.05, back toward the 20-day average. The lens for this week is whether that retracement settles in the shallow Fibonacci zone, or whether an RSI bearish divergence and heavier volume on the down days point to a deeper reset.
Snapshot as of Oct 23 close
| Item | Value | Read |
|---|---|---|
| Close | $9.05 | Below the 5-day average, above the 20- and 60-day averages |
| 52-week high / low | $9.36 / $5.90 | −3.3% from the high · +53.4% from the low |
| SMA 5 / 20 / 60 | $9.23 / $8.84 / $8.44 | 5 > 20 > 60 stacked (current run re-established Oct 8) |
| Bollinger (20, 2) | $9.47 / $8.84 / $8.22 | Band width 14.08%; price back near the middle band |
| aVWAP 90d (anchor Jul 23) | $8.36 | Short-term anchored VWAP well below the close |
| aVWAP 2y (anchor Sep 18, 2025) | $7.41 | Long-term anchored VWAP far below the close |
| RSI(14) | 58.3 | Cooling from ~73; bearish divergence flagged |
| Mansfield RS vs the S&P/ASX 200 | +21.45% | Outperforming; −1.63 pts on the week, +1.64 pts on the month |
| MACD (12,26,9) | 0.206 / 0.186 / +0.020 | Golden cross Oct 12; histogram narrowing |
| ADX(14) | 26.2 (90d) · 25.6 (2y) | Strong trend reading, just above 25 |
| ATR(14) | $0.197 (2.2%) | Moderate daily range |
| OBV | 90d: accumulation, rising · 2y: early accumulation, flat | OBV above its 20-day MA on both timeframes |
| Volume vs 20-day avg | 1.48× | Above average on a down day |
| 1× / 2×ATR technical invalidation | $8.85 / $8.66 | Volatility references below the close |
① Price & Moving Averages
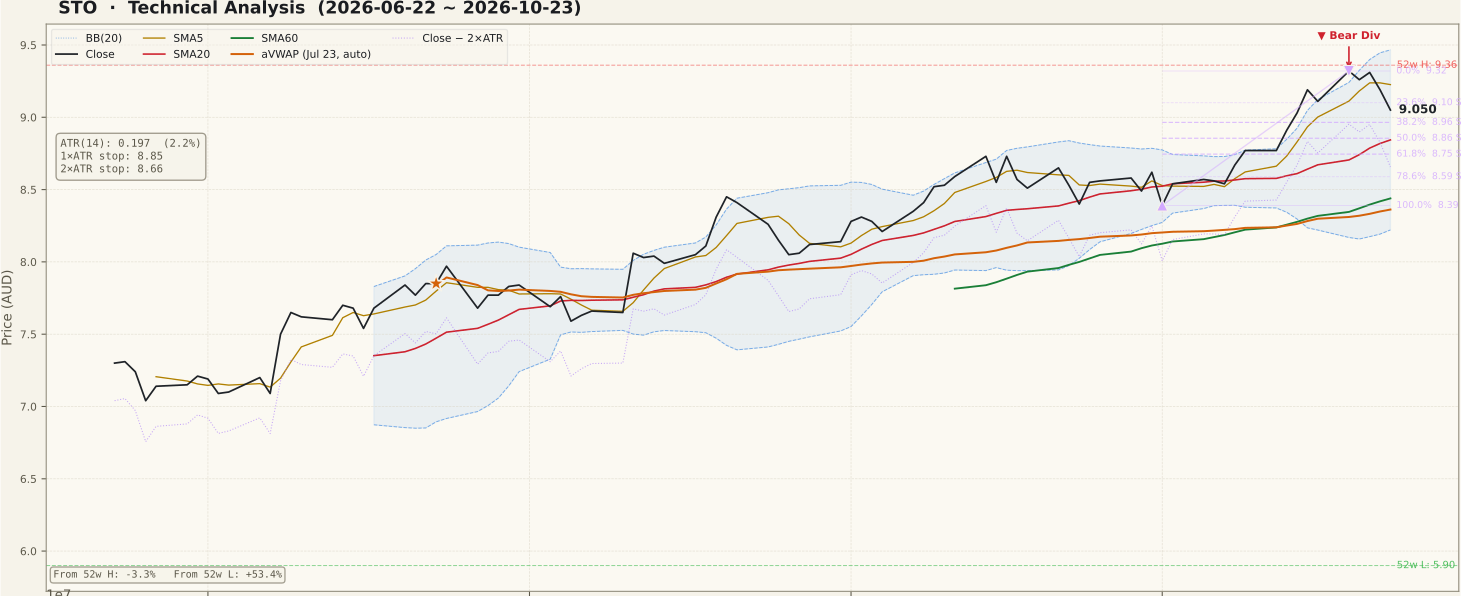
The averages are stacked in bullish order (SMA5 $9.23 > SMA20 $8.84 > SMA60 $8.44), all three sloping up. This alignment first formed on August 3, broke twice (August 6 and October 2) and re-formed on October 8, so the current run is about two weeks old rather than a continuous three-month stack. The close has been above the 60-day average since August 7 and back above the 20-day average since October 8.
The Fibonacci grid is drawn on the up-swing from $8.39 (October 1, the 100% anchor) to $9.32 (October 19, the 0% anchor). The close of $9.05 now sits below the 23.6% retracement ($9.10) and just above the 38.2% level ($8.96); the 50% retracement ($8.86) lines up almost exactly with the 20-day average and the middle Bollinger band. In the last session price also slipped back under the 5-day average, which is the first step of a pullback rather than evidence of a broken trend.
② Volume

Friday's volume was 1.48× its 20-day average (14.76 million shares against an average of 9.94 million). Across the ASX universe, median volume relative to its own average ran at roughly 0.79–1.03× over October 19–23, so this was a normal week for the market and the elevated reading is specific to Santos (roughly 1.4× after that market adjustment on October 22 and 23).
The detail worth noting is the direction: the two heaviest sessions of the week were the two down days. The run to the October 19 swing high came on lighter volume. Rising volume into a pullback is not, by itself, a break of trend, but it is the opposite of the quiet, drying-up volume that usually characterises a healthy retracement. No bar in the last 60 sessions exceeded a 6% move in either direction or 2.5× average volume.
③ MACD

MACD (0.206) remains above its signal line (0.186) after a golden cross on October 12, and both lines are well above zero. The histogram, however, has shrunk to +0.020 and the MACD line has turned down over the last two sessions, so momentum behind the October advance is fading. A cross back below the signal line would mirror the pattern seen in early October, when the previous dead cross preceded the dip to $8.39.
④ RSI

RSI(14) has eased to 58.3 after touching the overbought zone. A regular bearish divergence is flagged: price made a higher peak on October 19 ($9.32, RSI 72.66) than on September 14 ($8.73, RSI 73.67), while RSI made a slightly lower peak. The RSI gap between the two peaks is small, so this is a mild divergence rather than a pronounced one.
A divergence signals the possibility of a top, not a confirmed one. The reading at 58 is still in bullish territory; the more meaningful test would be whether RSI holds above the 50 line, which has broadly acted as a floor during the August–October advance.
⑤ Mansfield RS vs the S&P/ASX 200

Mansfield RS is +21.45% against the S&P/ASX 200, firmly in outperforming territory, and has been above zero since July. Compared with a week ago (+23.08%) it has slipped 1.63 points, so relative strength is positive but slowing in the short run; against a month ago (+19.81%) it is still 1.64 points higher, i.e. positive and accelerating on the monthly view. The two-year panel shows RS near the top of its range for the period, which is a supportive backdrop even while the latest week cooled.
⑥ ATR & ADX

ATR(14) is $0.197, or 2.2% of price, which puts the 1×ATR reference at $8.85 and the 2×ATR technical invalidation level at $8.66. ATR ticked up in the latest session as the daily range widened on the down move. ADX reads 26.2 on the 90-day series (25.6 on the 2-year series), just above the 25 threshold that separates a forming trend from a strong one. Because ADX measures strength rather than direction, the reading confirms that the move since early October has had some persistence; it does not by itself say which way the next leg goes.
⑦ OBV

On the 90-day view OBV is tagged accumulation: above its 20-day MA (by 0.72%) with a rising slope. On the 2-year view it is early accumulation: above its MA (by 0.17%) but flat. Both readings are positive, though thin — the last two heavy down sessions have pulled OBV back toward its moving average. No OBV divergence is flagged in the data on either timeframe, so this is a softening to watch rather than a signal.
Bull Case vs Bear Case
Bull Case
- SMA5 > SMA20 > SMA60, all rising; close above the 60-day average since August 7.
- Mansfield RS +21.45% vs the S&P/ASX 200 and higher than a month ago.
- MACD above its signal line and above zero after the October 12 golden cross.
- Pullback so far is shallow, stopping just above the 38.2% retracement ($8.96).
- OBV above its 20-day MA on both the 90-day and 2-year views.
- ADX above 25 and both anchored VWAPs ($8.36 and $7.41) well below price.
Bear Case
- RSI bearish divergence: higher price peak on Oct 19 with a lower RSI peak than Sep 14.
- The two heaviest volume sessions of the week were down days (1.48× average on Friday).
- MACD histogram narrowing to +0.020 with the MACD line turning lower.
- Close slipped below the 5-day average and the 23.6% retracement ($9.10).
- Relative strength cooled 1.63 points on the week.
- The current moving-average stack is only about two weeks old after breaking on October 2.
Scenarios
| Scenario | Probability | Path | Trigger / Invalidation |
|---|---|---|---|
| Shallow pullback, trend resumes | 45% | Price steadies in the $8.85–$8.96 zone (50%–38.2% retracement, 20-day average) and works back toward $9.32–$9.36. | Trigger: a close back above $9.10 with RSI holding above 50. Invalidated by a close below $8.66. |
| Sideways consolidation | 30% | Range between roughly $8.75 and $9.32 while the divergence resolves and the averages catch up. | Trigger: MACD flattening near its signal line without a decisive close outside the range. |
| Deeper reset | 25% | Close below the 2×ATR level opens the 78.6% retracement ($8.59), then the 60-day average ($8.44) and 90-day aVWAP ($8.36). | Trigger: a close below $8.66 on above-average volume with MACD crossing below its signal line. |
Key Levels & Volatility References
| Price | Role | Basis |
|---|---|---|
| $9.36 | Resistance | 52-week high |
| $9.32 | Resistance | Fibonacci 0% / swing high close (Oct 19) |
| $9.10 | Reclaim level | Fibonacci 23.6% retracement — now just above the close |
| $9.05 | Current | Oct 23 close |
| $8.96 | Support | Fibonacci 38.2% retracement |
| $8.86 | Support | Fibonacci 50% retracement · 20-day average $8.84 · 1×ATR $8.85 |
| $8.66 | Invalidation | 2×ATR technical invalidation level |
What to Watch
- Whether the pullback stabilises in the $8.85–$8.96 cluster (38.2%–50% retracement and the 20-day average).
- Volume on any further down days — a return to below-average volume would ease the concern raised this week.
- RSI versus the 50 line, and whether a new price high comes with a higher RSI peak to cancel the divergence.
- MACD: a dead cross below the signal line is the momentum condition tied to the deeper-reset scenario.
- Mansfield RS direction after this week's 1.63-point dip.