TPG Telecom
This analysis is based on closing-price data as of October 23, 2026. Whether you're researching TPG Telecom (TPG) on the ASX or learning how to read stock charts, here are objective support, resistance and technical invalidation levels built from the RSI, MACD and ATR indicators.
Over two years, TPG Telecom's chart is dominated by a large one-day repricing gap on November 14, 2025 (an unfilled zone from $4.08 to $5.57), after which the shares have traded in a much lower, broadly sideways band above the 52-week low of $3.47. This week's signal is not a price breakout: the close of $3.86 sits inside a narrow Bollinger range ($3.67–$3.93) and below the recent closing highs, while the notable event was a 5.4x volume session on a small down day alongside a fresh MACD golden cross. The right lens is a quiet, range-bound stock where momentum has just turned up and an unexplained burst of volume needs to be interpreted with care.
Snapshot as of Oct 23 close
| Metric | Value | Read |
|---|---|---|
| Close | $3.86 | Above SMA5 / SMA20 / SMA60 |
| 52-week high / low | $5.85 / $3.47 | −34.0% / +11.2% (high predates the Nov 14, 2025 gap) |
| SMA5 / SMA20 / SMA60 | $3.84 / $3.80 / $3.76 | SMA5 > SMA20 > SMA60 (re-formed Oct 22) |
| Bollinger (20) | $3.93 / $3.80 / $3.67 | Band width 6.79% — compressed |
| aVWAP 90d (anchor Sep 18, 2026) | $3.84 | Price slightly above |
| aVWAP 2y (anchor Nov 14, 2025) | $3.88 | Price slightly below |
| RSI(14) | 56.0 | Neutral-positive, no divergence flagged |
| Mansfield RS vs the S&P/ASX 200 | −2.34% | Underperforming but rising (week +4.30 pts, month +2.80 pts) |
| MACD (12,26,9) | 0.0090 / −0.0006 / +0.0096 | Golden cross Oct 21, near the zero line |
| ADX(14) | 14.6 | Ranging / weak trend |
| ATR(14) | $0.082 (2.1%) | Low volatility |
| OBV 2y / 90d | Early distribution, flat / Improving, rising | Bullish OBV divergence flagged on both |
| Volume vs 20-day average | 5.40x (19,500,762) | Heavy volume on a −0.52% day |
| 1× / 2×ATR technical invalidation | $3.78 / $3.70 | 2×ATR level used as the reference |
① Price & Moving Averages
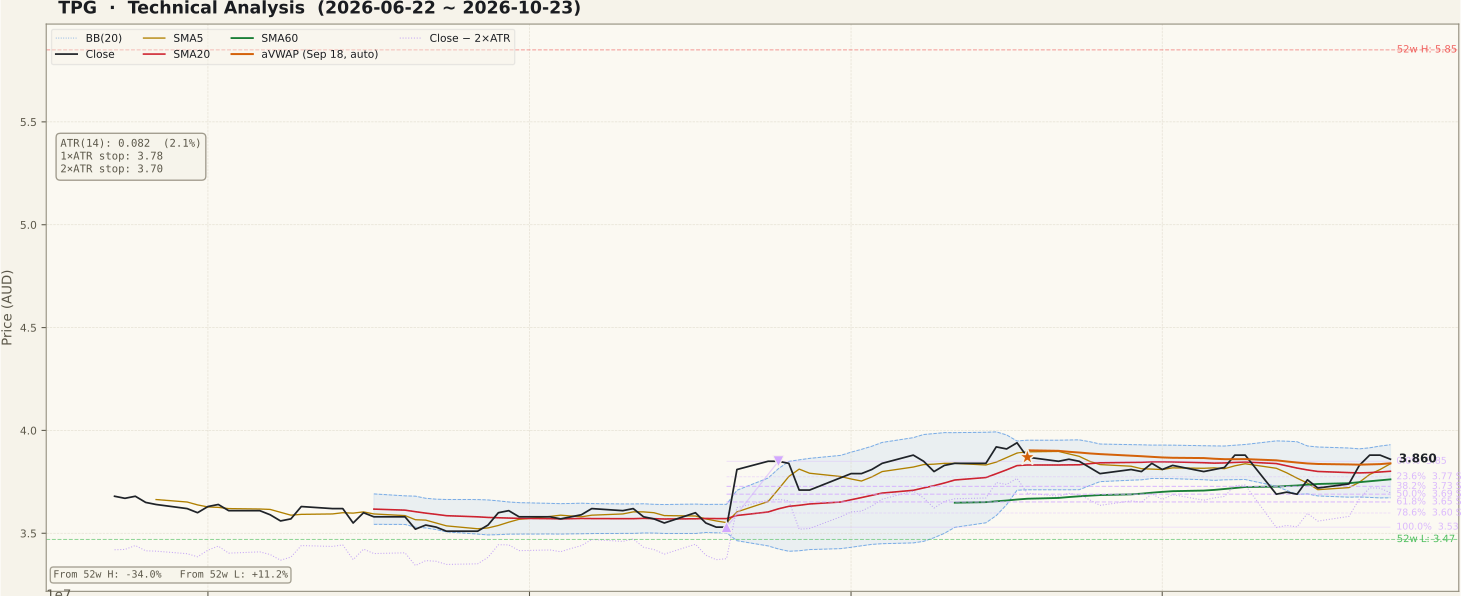
The short-term moving averages have re-stacked bullishly: SMA5 ($3.84) > SMA20 ($3.80) > SMA60 ($3.76) on a closing basis from October 22. This alignment first formed on August 26, broke on September 25 and has now re-formed, so it is a re-establishment rather than a new trend. The close moved back above both the SMA20 and SMA60 on October 20, after an unexplained −4.90% drop on October 12 had taken it beneath them. The three averages are tightly bunched, which is what a range looks like rather than a trend.
Price is sandwiched between the two anchored VWAPs — just above the 90-day aVWAP ($3.84, anchored on September 18) and just below the 2-year aVWAP ($3.88, anchored on the November 14, 2025 gap day). Importantly, the shares have not closed above their prior 20-day closing high in this round; the last close above it was September 15. The upper Bollinger Band at $3.93 and the unfilled gap starting at $4.08 are the next overhead references, with the 2-year Fibonacci 23.6% level of the down swing at $4.19 above that.
② Volume

The defining feature of this round is the October 23 session: 19,500,762 shares against a 20-day average of 3,612,109, a ratio of 5.40x, while the price slipped 0.52%. The broader ASX universe was not unusually busy that week (median volume ratios of roughly 0.79–1.03x), so on a market-adjusted basis the spike is still about 5.2x and specific to this stock. No announcement or large-holder transaction explaining it was located, so the cause is unidentified and this page does not guess at it.
Heavy volume on a flat-to-lower close is ambiguous: it shows large interest changing hands without the price advancing. The only comparable bar in the 90-day window is September 18 (7.6x, −1.8%), which coincided with the September index rebalance and sits outside the recent window. The three gains from October 19 to October 21 came on ordinary volume, so the recent price recovery itself was not volume-confirmed.
③ MACD

MACD crossed above its signal line on October 21 (MACD 0.0090 vs signal −0.0006, histogram +0.0096). The histogram has turned from red to green and the MACD line has edged just above zero. Because the cross happened right around the zero line after a September–October decline in momentum, it marks momentum turning up from a neutral base rather than an established uptrend. The absolute values are very small, consistent with the low-volatility range.
④ RSI

RSI(14) is 56.0, back above the 50 midline after dipping toward the high 30s around the October 12 drop. That is a moderate improvement with plenty of room before overbought territory. No RSI divergence is flagged in the data. An RSI in the mid-50s inside a range is consistent with balance tilting slightly positive, not with strong directional momentum.
⑤ Mansfield RS vs the S&P/ASX 200

Mansfield RS vs the S&P/ASX 200 is −2.34%, still below zero, so TPG remains a relative underperformer. The trend is improving: a week ago the reading was −6.64% (+4.30 points) and a month ago −5.14% (+2.80 points), placing it in the negative-improving quadrant on both horizons. On the 90-day view the line has climbed steadily from deep negative territory in August to just under zero. A negative-but-rising RS is an early-stage improvement; a move above zero would be needed before calling it relative leadership.
⑥ ATR & ADX

ATR(14) is $0.082, or 2.1% of price — low for an equity and consistent with the compressed Bollinger width of 6.79%. ADX is 14.6, below 20, which classifies the stock as ranging with no meaningful trend strength in either direction. That combination (low ATR, low ADX, narrow bands) often precedes a directional expansion, but it says nothing about which direction. The 2×ATR technical invalidation level sits at $3.70.
⑦ OBV

The OBV states differ by timeframe: the 2-year reading is early distribution (OBV below its 20-day average, flat, −13.91% from that average) and the 90-day reading is improving (below its average but rising, −42.51% from it). Both timeframes flag a bullish OBV divergence between September 21 (price $3.85) and October 14 (price $3.69): price made a lower point while OBV made a higher one (90-day OBV −32.02M vs −24.11M). However, because October 23 was a down close, its entire 19.5M-share volume was subtracted from OBV, taking the 90-day value to −33.25M — below the September 21 reference. In other words, the higher OBV low that defined the divergence is no longer intact at the latest reading, and the divergence is best treated as weakened rather than confirmed.
Bull Case vs Bear Case
Bull Case
- SMA5 > SMA20 > SMA60 re-formed on October 22, with the close above all three.
- MACD golden cross on October 21 near the zero line, histogram now positive.
- RSI back above 50 at 56.0 with room before overbought.
- Mansfield RS improving on both week (+4.30 pts) and month (+2.80 pts) horizons.
- Compressed Bollinger width (6.79%) and low ATR set up a potential volatility expansion.
- Price is above the 90-day aVWAP ($3.84), so recent participants since September 18 are on average in profit.
Bear Case
- No price breakout: the close remains below the recent closing highs and the upper band at $3.93.
- The 5.4x volume came on a down day with an unidentified cause — not a confirmation of strength.
- That session pushed 90-day OBV below the September 21 reference, undercutting the OBV divergence.
- Mansfield RS is still negative (−2.34%) — the stock is lagging the S&P/ASX 200.
- ADX of 14.6 means no trend; moving-average alignment in a range breaks easily (it already broke once on September 25).
- Overhead supply: the 2-year aVWAP at $3.88 and the unfilled gap from $4.08 to $5.57.
Scenarios
| Scenario | Probability | Path | Trigger / Invalidation |
|---|---|---|---|
| Range continues | 45% | Price keeps oscillating between the Bollinger bands ($3.67–$3.93) while volume normalises after the October 23 spike. | Closes staying between $3.70 and $3.93; ADX remaining below 20. |
| Upside resolution | 30% | A close above $3.93 clears the 2-year aVWAP and the upper band, opening the gap floor at $4.08 and the 23.6% level at $4.19. | Trigger: close above $3.93 on above-average volume with an up close. Invalidated by a close below $3.70. |
| Downside resolution | 25% | The heavy-volume down day proves to be distribution; price loses the SMA20/SMA60 cluster and drifts toward the lower band and the 52-week low. | Trigger: close below the 2×ATR level of $3.70, then the lower band at $3.67; next reference $3.47. |
Key Levels & Volatility References
| Price | Role | Basis |
|---|---|---|
| $4.08 | Resistance | Lower edge of the unfilled Nov 14, 2025 gap ($4.08–$5.57) |
| $3.93 | Resistance | Upper Bollinger Band |
| $3.88 | Resistance | 2-year aVWAP (anchor Nov 14, 2025) |
| $3.86 | Current | Oct 23 close |
| $3.84 | Support | 90-day aVWAP (anchor Sep 18, 2026) / SMA5 |
| $3.80 | Support | SMA20 / Bollinger mid |
| $3.70 | Invalidation | 2×ATR technical invalidation level |
What to Watch
- Whether any explanation emerges for the October 23 volume of 19.5M shares (5.4x average) — the reading of this setup depends heavily on it.
- A close above $3.93 (upper band, clear of the $3.88 aVWAP) on an up day with strong volume, which would turn a volume event into a price breakout.
- Whether 90-day OBV recovers back above the October 14 reference, restoring the bullish divergence.
- Mansfield RS crossing above zero versus the S&P/ASX 200.
- A close below $3.70 (2×ATR), which would invalidate the momentum turn.