The ATR Invalidation Level
Every SwingRoo analysis quotes a level a fixed multiple of ATR beneath the close. The multiple is a convention. The distance it produces is a measurement — and on the ASX those two facts come apart more often than the arithmetic suggests.
One
Every SwingRoo analysis quotes two prices beneath the most recent close, one at a single ATR and one at twice it. The second carries the technical invalidation label, and it is the one that reaches Key Levels and the scenario table.
Both are the same arithmetic with a different multiplier: a price sitting a fixed multiple of Average True Range below the close.
The two halves of that block do different kinds of work. The multiple is chosen. The distance it produces is measured, because ATR reports how much ground the stock has actually been covering from one session to the next.
There is no threshold to cross and no zero line anywhere in it. The reference point is the most recent close, and the multiple is the only free parameter in the whole construction.
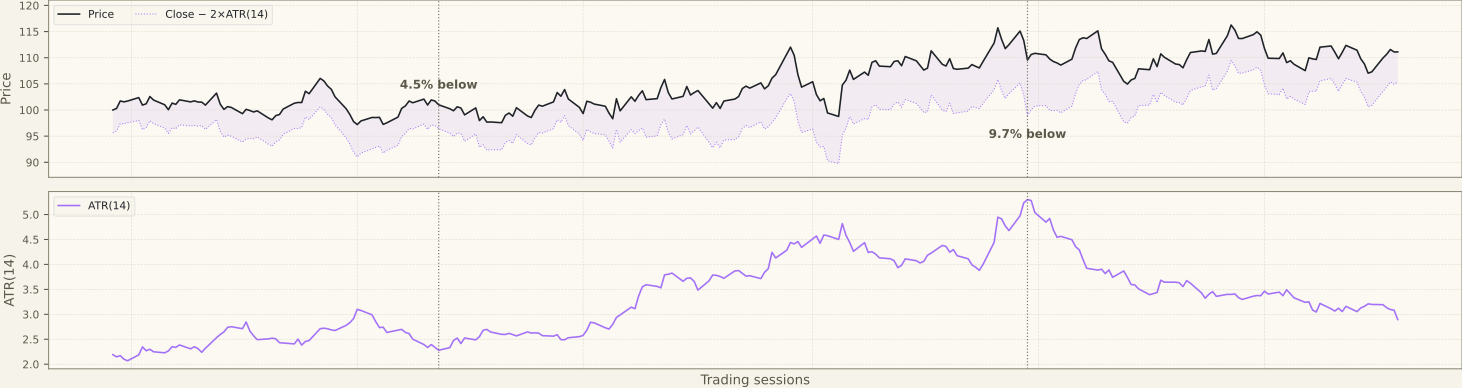
The figure follows one stock across 250 sessions with the multiple fixed at two throughout. The distance beneath the close reads 4.5% at the first marker and 9.7% at the second.
Nothing about the arithmetic changed between them. The lower panel is the reason — ATR roughly doubled, and the same multiple applied to a larger number lands further away.
The middle of that window repays a second look. Inside the stretch where the band is widest there is an 11.8% decline, and the band is as wide through the decline as through the advance on either side of it.
True Range counts ground covered, not the direction it was covered in. Section four comes back to that, but the figure has already shown it.
Average True Range itself comes from J. Welles Wilder Jr., New Concepts in Technical Trading Systems (1978), where it is defined as a measure of volatility.
Placing a reference level at a multiple of that measure is a later convention built on top of the definition, and section four is about where the convention came from.
Two
The reading is a percentage before it is a price. A level 4% beneath the close and one 9% beneath the close describe two different stocks even when the dollar figures are similar.
| Reading | What it says |
|---|---|
| Level sits far below the close in percentage terms | Recent daily ranges have been wide; the same multiple buys more room |
| Level sits close to the price in percentage terms | Range has compressed; the same multiple buys less room, and ordinary movement reaches it sooner |
| ATR rising while price rises | The level trails upward, but the gap beneath the close widens at the same time |
| ATR rising while price falls | The level falls faster than price — the distance widens on the way down, when it is least useful |
| Level coincides with a retracement or a prior shelf | Two unrelated methods arrive at the same price; the agreement is the information, not either figure alone |
| Price already beneath the level | The move the analysis described has been contradicted by the chart's own volatility yardstick |
The event the level describes is a daily close beneath it. Intraday penetration is a different thing, because the level is constructed from closing prices and we quote it against the close.
That is also why the analyses carry both multiples rather than one. The 1× figure sits inside the ground an ordinary session already covers; the 2× figure is the one the scenario table treats as a structural break.
Three
Three stocks from the scan of 2 August 2026 landed at three different distances — same index, same scan date, same multiple of two. That shared arrangement is what makes the comparison mean anything.

Viva Energy shows the level doing the job it is defined for. ATR(14) at $0.095 was 3.3% of the $2.85 close, lifting off its July lows as the range expanded, with ADX at 33.8 in a strong-trend regime.
The 2×ATR level at $2.66 sat 6.7% beneath the close, and the published analysis names it as the test the breakout has to survive. The panel above shows the range expanding into the move — the one case where a widening distance and the direction agree.
PWR Holdings was the widest of the batch. ATR(14) of $0.44 on a $9.92 close — 4.5% of price — put the level at $9.04, 8.9% beneath it.
ADX read 23.7 there, an emerging trend rather than an established one. The width came from the range, not from the trend.
Bega Cheese was the narrowest, and the pair to PWH. ATR(14) of $0.137 on a $6.09 close — 2.25% of price — put the level at $5.82, 4.5% beneath it.
Same multiple, same index, same scan date: 8.9% on one stock and 4.5% on the other, a factor of 1.98. That number is measured rather than constructed, which is what makes it the useful one on this page.
Bega carries a second reading as well. The $5.82 level landed one cent under the 38.2% retracement at $5.83 — two unrelated methods arriving at the same price, which is the last row of the table above with a real instance attached.
Four
Six readings of this level recur often enough to be worth naming. In each case the claim describes something the level does not report, and the correction states what it reports instead.
The level is a number to act on.
It reports a distance. It states how far below the close the stock's own recent daily range would have to carry it before the structure described in the analysis has been contradicted. It reports nothing beyond that.
The multiple of 2 is derived from something.
It is a convention. Nothing in the arithmetic produces it. What the arithmetic produces is the scaling — the same multiple lands a few percent below the close on a quiet stock and two or three times that on a volatile one. The multiple is chosen; only the scaling is measured.
A smaller multiple means less exposure.
A smaller multiple places the level inside the range the stock covers on an ordinary session, so ordinary movement reaches it. Distance and exposure are two different quantities, and shortening the first does not shorten the second.
The dotted line on the price chart and the figure in the table are the same object.
The line applies the arithmetic to every bar, so it moves with price and with volatility together. The figure is one bar's arithmetic, taken at the most recent close. Reading the line's history as though that single figure had been in force throughout describes a calculation nobody performed.
A widening distance means the stock is weakening.
True Range counts movement in either direction. A stock making large upward daily moves widens the distance exactly as a stock breaking down does, which is why the level is read alongside direction and never instead of it.
A widening percentage distance means the range has expanded.
The percentage is the distance divided by the close, so a falling price widens it even when the range has not moved at all. Part of what reads as rising volatility is the smaller denominator. The dollar figure and the percentage answer different questions, and only the first is a measurement of range.
The second of those is the reason this page exists, so it deserves more than a line in a table. Nothing in the arithmetic produces the number two.
Wilder's own volatility system in New Concepts placed a reference at a multiple of average range as well. Which multiple it used, and whether it is the one we use, is something we have not checked against the primary text, so no figure for it appears here.
The rule set circulated for the Turtle programme is widely described as placing a level at a multiple of ATR. Those documents are second-hand and no primary source from the traders has been published, so the description belongs to the documents rather than to the people.
Whether a volatility-scaled distance does better than a flat percentage is an empirical question with mixed published results. This page does not settle it, and our own choice of two is a convention we adopted rather than a conclusion we reached.
What the arithmetic does produce is the scaling, and that part is worth seeing on its own.
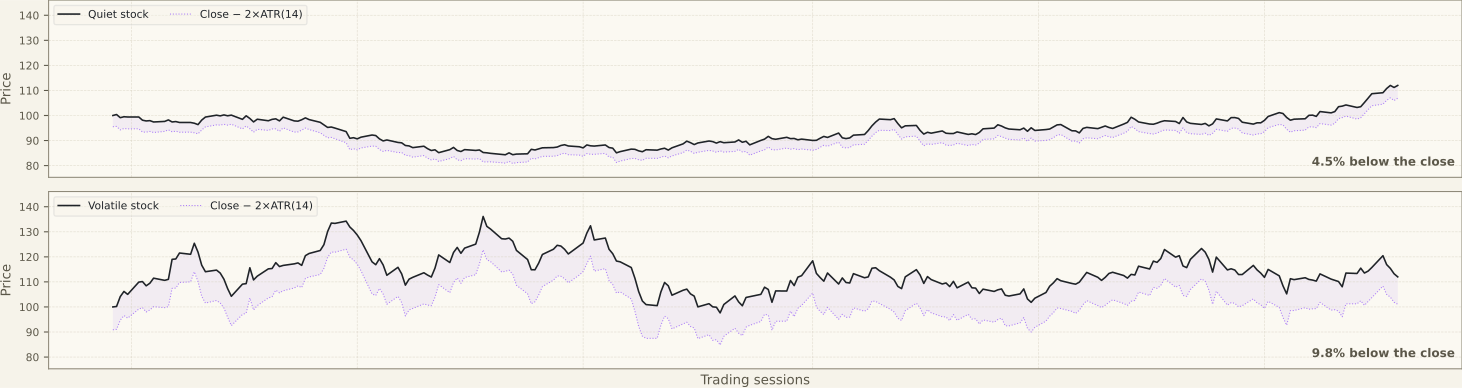
Those two panels are one moment rather than one history. Two stocks, the same multiple applied on the same day, landing 4.55% and 9.75% beneath their respective closes — a factor of 2.14.
That 2.14 is a designed number. The synthetic pair was built to a constraint of at least twice the distance, so the contrast is a property of the illustration rather than a finding.
The measured version is the 1.98 of the ASX pair in section three, and the closeness of the two figures is not evidence of anything. One was constructed to clear a threshold; the other is what a single scan happened to produce.
The distinction against the first figure matters in the same way. Section one followed one stock changing over 250 sessions; this one compares two stocks at a single instant. The numbers are similar by design, and the two claims are different claims.
The last of the six is the easiest to miss, because it hides inside the percentage itself. A distance quoted as a share of price carries the close in its denominator, so a falling price widens the percentage even when the range has not moved at all.
Part of what reads as rising volatility is the smaller denominator. The dollar figure and the percentage answer different questions, and only the first is a measurement of range.
Five
The level has structural limits that apply on any market:
- Backward-looking by construction. Fourteen sessions of past range carry no claim about the next session's range, and the level inherits that silence.
- True Range includes the gap from the previous close, so ATR expands after the gap has occurred. The level widens in response to an event, never in anticipation of one.
- Volatility clusters. A level set during a calm stretch is reached easily once the regime changes, and it does not adjust until the range has already expanded.
- The recursion is seeded from the first true range rather than a 14-session mean, so on a short history the figure still carries its starting bar. Readings on recently listed stocks are not comparable to the same figure on a long history.
- Downside only. There is no symmetric counterpart in this pipeline, so the level says nothing about how far an advance would have to run before it counted as extended.
- An unadjusted price series turns a split or a large distribution into a false range expansion, which widens the level for reasons that have nothing to do with the stock's behaviour.
And it has weaknesses specific to the ASX, most of which trace back to when this market trades and what trades on it:
- ASX trading halts are common on small and mid-caps and can run for days around a capital raising or an announcement. True Range measures from the previous close, so the entire move that accumulated during the halt lands in a single session's range on resumption. ATR expands sharply the day after the news, which means the level widens once the event it should have measured is already in the price.
- The ASX opens after the US close, so offshore movement arrives as an opening gap rather than as continuous trade. True Range counts the gap from the previous close, so an ASX reading structurally carries an overnight component that a market trading through the same hours would spread across the session. Resources and energy names carry the most of it, because their pricing is set in offshore sessions.
- SwingRoo screens the S&P/ASX 300 with a A$2M median daily turnover floor. Beneath roughly that level the daily high-to-low range is partly the bid-ask spread rather than movement, so the reading widens the distance for a reason that has nothing to do with the stock's behaviour. Junior resources names on thin turnover are where this is most pronounced.
- Australian yields are high and franking encourages large fully-franked distributions, so the ex-dividend drop is proportionally bigger here than in most markets. SwingRoo uses an adjusted series, so the drop does not register as range. A reader comparing against an unadjusted chart elsewhere will see a one-day range expansion on the ex-date that is entirely an artefact of the adjustment, not of volatility.
Analyses using this reading
- Viva Energy Group (VEA) · 2 August 2026
- PWR Holdings (PWH) · 2 August 2026
- Bega Cheese (BGA) · 2 August 2026
Last reviewed 5 August 2026