Bega Cheese Limited
This analysis is based on closing-price data as of July 31, 2026. Whether you're researching Bega Cheese Limited (BGA) on the ASX or learning how to read stock charts, here are objective support, resistance and technical invalidation levels built from the RSI, MACD and ATR indicators.
Over the two-year window, BGA has worked through a long, choppy range and, since late 2025, a stair-stepping recovery that now sits within 10% of the 52-week high of $6.72. The stock closed Friday at $6.09 — above its 20- and 60-day averages and comfortably above both anchored VWAPs — while outperforming the S&P/ASX 200 by +4.3% on the Mansfield scale. The near-term tension is that this constructive structure has just been met by a cluster of caution flags: a bearish RSI divergence into the July 29 high at $6.22, a fresh MACD dead cross dated July 31, and on-balance volume slipping below its 20-day average. The lens for the week is a pullback within an uptrend: whether the $6.04–$6.00 support retest zone absorbs the digestion, or whether the divergence resolves into something deeper.
Snapshot as of Jul 31, 2026
| Item | Value | Read |
|---|---|---|
| Close | $6.09 | −9.4% from 52w high · +23.5% from 52w low |
| 52-week high / low | $6.72 / $4.93 | Upper third of the yearly range |
| SMA 5 / 20 / 60 | $6.17 / $6.04 / $5.69 | Close below SMA5, above SMA20 & SMA60 — short pause in an up-structure |
| Bollinger (20) | $6.27 / $6.04 / $5.80 · width 7.72% | Mid-band aligns with SMA20 support |
| aVWAP (2y anchor Feb 21, 2025) | $5.59 | Price well above — long-term holders in profit |
| aVWAP (90d anchor Apr 28, 2026) | $5.61 | Price well above — recent positioning underwater only below $5.61 |
| RSI(14) | 57.4 | Bearish divergence: Jul 20 → Jul 29 (see §4) |
| Mansfield RS (vs the S&P/ASX 200) | +4.26% | Outperforming; weekly change −1.56pp (slowing), monthly +0.08pp |
| MACD (12,26) | 0.106 vs signal 0.111 · hist −0.004 | Dead cross on Jul 31, well above the zero line |
| ADX(14) | 21.5 | Emerging trend (20–25 band) |
| ATR(14) | $0.137 · 2.25% of price | Moderate volatility |
| OBV (2y) | Below MA20 · div −1.39% · flat | Early distribution |
| OBV (90d) | Below MA20 · div −9.25% · flat | Early distribution — sharper on the short frame |
| Volume vs 20d avg | 1.31× | Above average into Friday's close |
| Technical invalidation (1× / 2× ATR) | $5.95 / $5.82 | 2×ATR level is the objective structure-failure reference |
① Price & Moving Averages
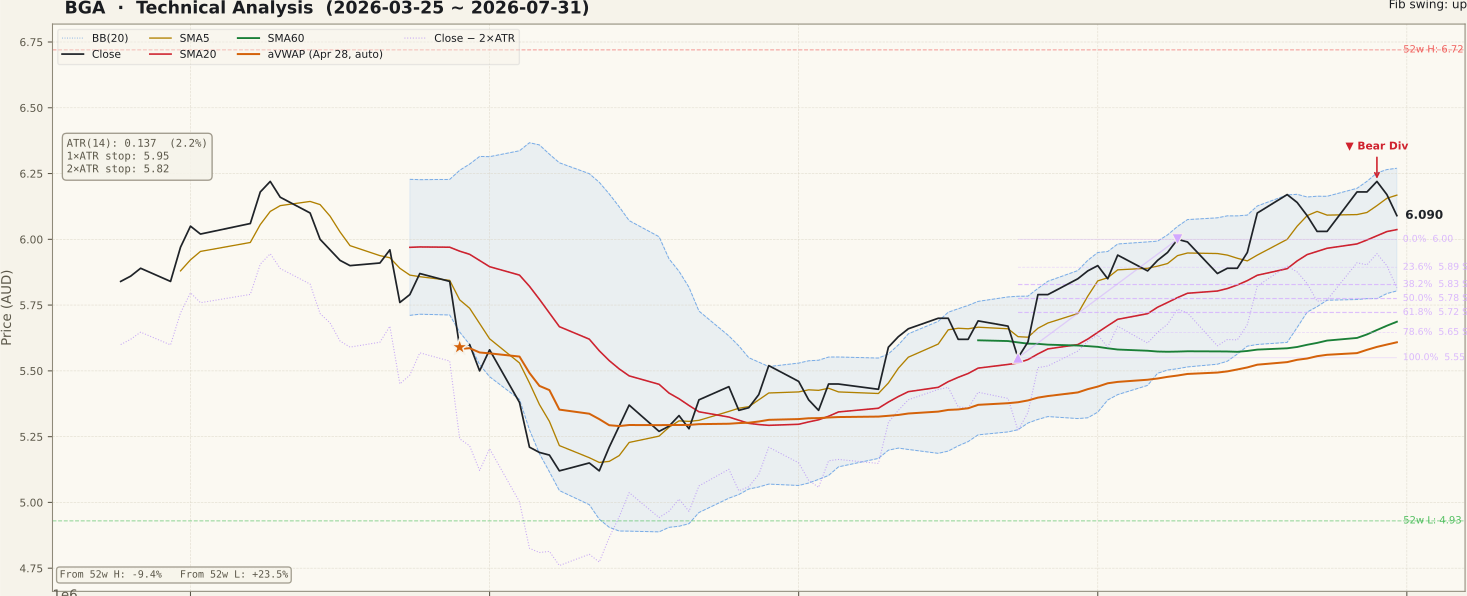
The 90-day frame shows a May base near $5.13, a June higher low at $5.55, and a July advance that broke the $6.00 swing high (Jul 9) and pressed to $6.22 on July 29. The close at $6.09 sits just under the 5-day average ($6.17) but above the 20-day at $6.04 — a shallow pause rather than a breakdown, so far. The moving-average stack (Close > SMA20 > SMA60) remains upward-ordered, and both anchored VWAPs ($5.59 on the two-year anchor, $5.61 on the April 28 anchor) sit well below price, meaning the average holder since either anchor is in profit and overhead supply from trapped positions is limited until the $6.22–$6.27 area. Bollinger width of 7.72% is moderate; the upper band at $6.27 capped the late-July push. Fibonacci retracements of the June–July up swing ($5.55 → $6.00) mark the deeper supports: 23.6% at $5.89, 38.2% at $5.83, 50% at $5.78. Notably, both gaps in the two-year window have been filled — no open gap acts as a magnet in either direction.
② Volume

Friday printed 991,712 shares against a 758,736 20-day average — a 1.31× ratio, so participation is above normal but not climactic. The July advance was carried mostly on ordinary volume with no sustained spike cluster, which is the one soft spot in an otherwise clean breakout: rallies that clear a prior swing high ideally attract expanding turnover. At roughly A$6M of daily value traded, BGA is liquid enough that the volume signals here are readable, but the absence of a conviction spike means the tape has not yet confirmed the July high. Watch whether any retest of the $6.04–$6.00 zone happens on shrinking volume (constructive digestion) or expanding red bars (distribution pressure).
③ MACD

MACD printed a dead cross on July 31 — the as-of date itself — with the line at 0.106 slipping under the signal at 0.111 and the histogram turning fractionally negative (−0.004). Context matters: this cross is occurring well above the zero line after a two-month advance, which historically reads as momentum cooling within an uptrend rather than a trend reversal on its own. The 90-day panel shows the line flattening since mid-July while price ground higher — the momentum engine was already idling before the cross. A quick re-cross upward would neutralise the signal; continued histogram deterioration alongside a loss of $6.04 would upgrade it from "pause" to "correction."
④ RSI

RSI(14) sits at 57.4 — neutral-positive territory, having cooled from the overbought tag hit in mid-July. The flagged bearish divergence is specific: on July 20 price made $6.17 with RSI at 71.4, and on July 29 price pushed higher to $6.22 while RSI printed only 68.5. Higher high in price, lower high in momentum — the classic warning that the advance's internal thrust is fading. A common beginner mistake is to treat a divergence as an automatic top call; it is a conditional signal that needs price confirmation. Here the confirmation test is clear: if the $6.04–$6.00 support retest zone holds and RSI bases above 50, the divergence resolves benignly. If RSI loses the 50 midline while price undercuts $6.00, the warning is validated.
⑤ Mansfield Relative Strength

Mansfield RS vs the S&P/ASX 200 reads +4.26% — BGA is outperforming the index, and has held the positive side since early July after a negative stretch through May and June. The finer read: a week ago RS stood at 5.82, so the weekly change is −1.56 points — positive territory but slowing. Against a month ago (4.18) it is essentially flat at +0.08. In other words, the relative-strength edge is real but no longer widening; the stock is keeping pace with its July gains rather than extending them versus the market. Sustained outperformance through any pullback would be the strongest tell that institutions are defending the name; an RS slide back toward zero while the index holds up would be an early exit of that sponsorship.
⑥ ATR & ADX

ATR(14) is $0.137, or 2.25% of price — a moderate volatility regime, well down from the May spike near $0.19. That contraction during an advance is typical of orderly accumulation phases. ADX at 21.5 sits in the 20–25 "emerging trend" band: directional energy is building but a strong trend is not yet confirmed. Remember ADX measures strength, not direction — a downside break that accelerates would also lift ADX. The practical use of ATR here is the objective invalidation math: 1×ATR below the close is $5.95 and 2×ATR is $5.82, the level at which normal noise can no longer explain the weakness and the swing structure is considered technically invalidated.
⑦ On-Balance Volume

OBV is the most cautionary panel. On both frames the state is early distribution: OBV sits below its 20-day average with a flat slope — −1.39% divergence on the two-year frame and a sharper −9.25% on the 90-day frame. The short-frame reading matters most for timing: while price held near its highs into July 29, cumulative volume flow rolled over, echoing the RSI divergence with a second, independent non-confirmation. This is not yet heavy distribution — the slope is flat, not falling — but it says the July advance was not being aggressively absorbed at the top of the range. An OBV reclaim of its MA20 would repair this quickly; continued slippage alongside a break of $6.00 would confirm supply is winning.
Bull Case
- Upward-ordered structure: close above SMA20 ($6.04) and SMA60 ($5.69), both rising.
- Price well above both anchored VWAPs ($5.59 / $5.61) — average holders in profit, little trapped supply below.
- Mansfield RS +4.26% vs the S&P/ASX 200 — on the outperform side since early July.
- July broke the $6.00 swing high after a higher low at $5.55 — a constructive base-and-break sequence, +23.5% off the 52-week low.
- ADX 21.5 emerging with ATR contracting to 2.25% — volatility calming as trend energy builds.
- MACD dead cross occurred far above the zero line — historically more pause than reversal, and easily neutralised by a re-cross.
Bear Case
- Bearish RSI divergence: price $6.17 → $6.22 (Jul 20 → Jul 29) while RSI fell 71.4 → 68.5.
- OBV in early distribution on both frames, −9.25% divergence on 90d — volume flow did not confirm the July high.
- Fresh MACD dead cross dated the as-of day (Jul 31), histogram negative.
- Weekly RS change −1.56pp — relative-strength edge is slowing, not widening.
- Close slipped back under SMA5 ($6.17), and the $6.22–$6.27 supply zone (Jul 29 high + upper Bollinger band) capped two attempts.
- 52-week high $6.72 still −9.4% overhead; the July breakout lacked a conviction volume spike.
Scenarios
| Scenario | Probability | Path | Trigger / Invalidation |
|---|---|---|---|
| Constructive digestion, then higher | 45% | Shallow pullback into the $6.04–$6.00 support retest zone on fading volume; divergence resets; renewed push through $6.22 toward the upper band $6.27. | Trigger: daily close back above $6.22 with volume >1× average and OBV reclaiming its MA20. Invalidated below $6.00 on expanding volume. |
| Divergence resolves lower | 35% | RSI/OBV non-confirmation plus the MACD dead cross deepen the pullback through $6.00 into the fib supports at $5.89–$5.83, near the 1×ATR reference $5.95. | Trigger: close below $6.00 with RSI under 50. Swing structure technically invalidated on a close below the 2×ATR level $5.82. |
| Immediate extension | 20% | No meaningful pause — price clears $6.22/$6.27 directly and opens a run at the 52-week high $6.72 as an upside resistance level. | Trigger: gap-or-drive through $6.27 on ≥2× average volume (the spike the July advance lacked). Fades quickly if volume stays ordinary. |
Key Levels & Volatility References
| Price | Role | Basis |
|---|---|---|
| $6.72 | R | 52-week high — major upside resistance level, −9.4% above the close |
| $6.27 | R | Upper Bollinger band — capped the late-July push |
| $6.22 | R | July 29 swing high (bearish-divergence peak) — nearest overhead supply |
| $6.09 | Current | Friday's close (Jul 31) |
| $6.04 | S | SMA20 / Bollinger mid-band — first support, top of the retest zone |
| $6.00 | R | 0% of the Jun–Jul up swing (Jul 9 prior swing high; JSON role R) — pivot being retested from above |
| $5.82 | Invalidation | 2×ATR technical invalidation level — structure-failure reference below the fib 38.2% ($5.83) |
What to Watch
- The $6.04–$6.00 zone on any dip — shrinking volume into that support retest zone keeps the uptrend thesis intact; expanding red volume does not.
- OBV vs its 20-day average — a reclaim would cancel the early-distribution read; further slippage confirms the non-confirmation.
- MACD re-cross — a quick upward re-cross above the signal line would neutralise Friday's dead cross; a falling histogram deepens it.
- RSI 50 midline — holding above 50 through the pullback resolves the divergence benignly; losing it alongside $6.00 validates the warning.
- Relative strength vs the S&P/ASX 200 — RS holding positive through weakness signals defended sponsorship; a slide toward zero is an early caution.