Viva Energy Group Limited
This analysis is based on closing-price data as of July 31, 2026. Whether you're researching Viva Energy Group Limited (VEA) on the ASX or learning how to read stock charts, here are objective support, resistance and technical invalidation levels built from the RSI, MACD and ATR indicators.
VEA has completed a six-month repair job. After a long 2025 downtrend, the stock based near $1.70 in February 2026, rallied to $2.64 by April, digested that advance for three months, and has now broken out — closing Friday at $2.85, just 0.7% below the 52-week high of $2.87, with relative strength versus the S&P/ASX 200 accelerating. The catch is the temperature of the move: RSI(14) sits at 81.5 and the close is pressing above the upper Bollinger Band, so the structure is strong but statistically stretched — the kind of tape where late chasing is the classic beginner mistake.
Snapshot as of July 31, 2026
| Item | Value | Read |
|---|---|---|
| Close | $2.85 | Fresh 20-day high, upper edge of the 2-year range |
| 52-week range | $1.70 – $2.87 | −0.7% from the high · +68.1% off the low |
| SMA 5 / 20 / 60 | $2.69 / $2.43 / $2.27 | Bullish alignment, all rising; close 17.4% above SMA20 (extended) |
| Bollinger (20) | $2.83 / $2.43 / $2.02 · width 33.3% | Close above the upper band — stretched, bands expanding |
| aVWAP | 2y $2.08 (Feb 25, 2025) · 90d $2.33 (Jun 15, 2026) | Price above both — average holders from both anchors are in profit |
| RSI(14) | 81.5 | Deep overbought on both 2y and 90d frames |
| Mansfield RS (vs the S&P/ASX 200) | +33.2% | Outperforming and accelerating (prior week +20.0, prior month +2.0) |
| MACD (12,26,9) | 0.145 / signal 0.098 / hist +0.047 | Golden cross Jul 3, 2026; histogram still widening |
| ADX(14) | 33.8 (90d) · 33.3 (2y) | Strong trend regime |
| ATR(14) | $0.095 (3.3% of price) | Volatility picking up off the July lows |
| OBV | 2y: above MA20, rising (+177.3% vs MA20) · 90d: above MA20, rising (+46.0%) | Accumulation on both timeframes |
| Volume (last vs 20-day avg) | 10.31M vs 6.66M · 1.5x | Above average on the breakout, but short of a 2x spike |
| Technical invalidation (ATR-based) | 1×ATR $2.75 · 2×ATR $2.66 | 2×ATR level sits 6.7% below Friday's close |
① Price & Moving Averages
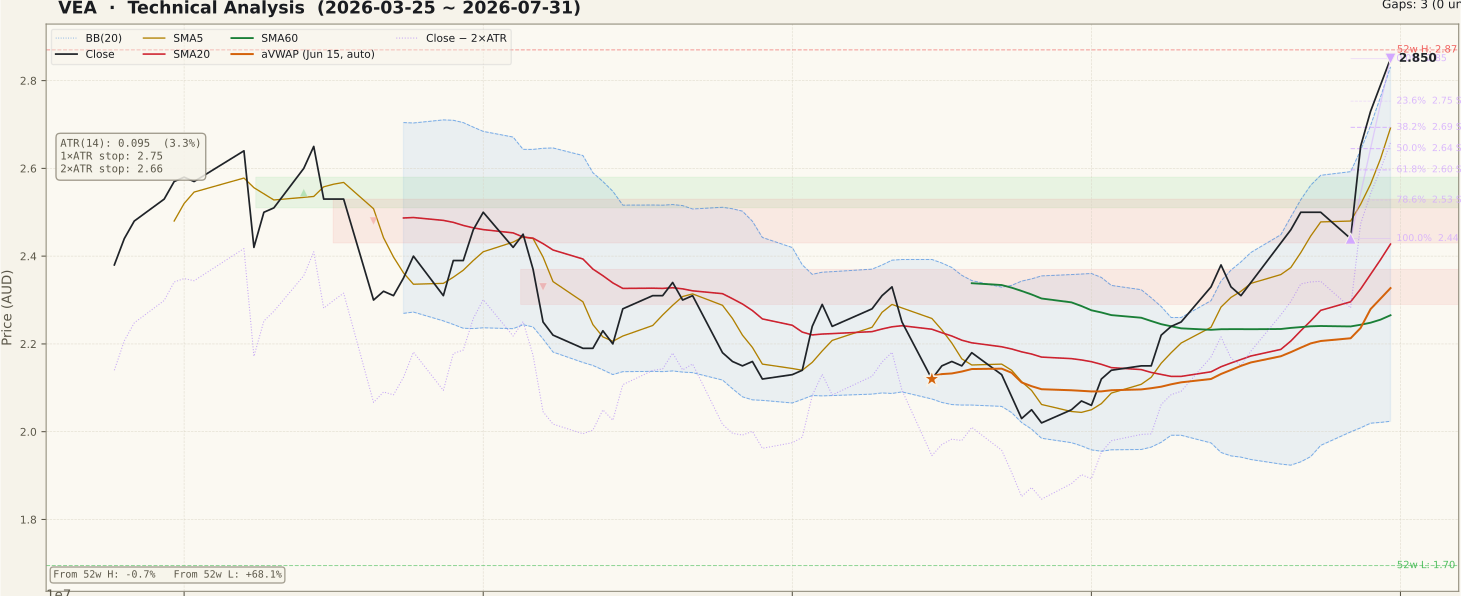
The two-year picture is a full round trip: a decline from above $3.00 in late 2024, a long base through 2025, a February 2026 low at $1.70, and a stage-2 advance since. The April swing high at $2.64 capped the stock for three months; the late-July thrust cleared it decisively, and Friday's $2.85 close now sits within one average day's range of the 52-week high at $2.87. Moving averages are in bullish alignment — close above SMA5 ($2.69), SMA5 above SMA20 ($2.43), SMA20 above SMA60 ($2.27), all rising.
The stretch is the caveat. Price closed above the upper Bollinger Band ($2.83) and stands 17.4% over its own 20-day average, with band width expanding to 33.3%. On the 90-day frame the last swing ran from $2.44 (Jul 27) to $2.85 (Jul 31) — roughly four ATRs in a week. Retracement references from that swing sit at $2.75 (23.6%), $2.69 (38.2%) and $2.64 (50%, which overlaps the old April high — the most important shelf: prior resistance that should now act as a support retest zone). No unfilled gaps remain on either timeframe.
② Volume

Friday printed 10.31M shares against a 6.66M 20-day average — 1.5x. That is a respectable confirmation for a range breakout, and the chart shows volume building through the final week of July with spike days (2x or more) appearing as the advance got going. It is, however, not the 2x-plus climax bar that marks the strongest breakouts, so follow-through volume matters: a push through $2.87 on thin turnover would be easier to fade than one on heavy participation. VEA is a large, liquid ASX name, so the volume signal itself is trustworthy — this is not a thin-stock print.
③ MACD

MACD crossed above its signal line on July 3, 2026 and the spread has widened steadily since: MACD 0.145 versus signal 0.098, histogram +0.047 and still growing. The cross occurred below the zero line and has since driven well into positive territory — the sequence you want to see in an early trend leg, and consistent with the June-July chop resolving upward. The main caution is altitude: MACD is now at its highest level of the 90-day window, so the indicator confirms momentum rather than offering an early signal. A flattening histogram over the coming week would be the first quiet hint that the thrust is cooling, before price shows it.
④ RSI

RSI(14) reads 81.5 — deep overbought on both the 2-year and 90-day frames, and the highest reading of the past two years of this chart. Two honest readings coexist here. First, extreme RSI on a fresh range breakout is often a mark of strength: in strong trends RSI can stay pinned above 70 for weeks, and "overbought" alone is not a reversal signal. Second, statistically this is where risk-reward for new exposure deteriorates — a stock 68% off its low, above its upper band, at RSI 81, frequently needs to pause or pull back toward its breakout shelf before the trend resumes. No RSI divergence is detected in the data (peaks not flagged), so there is no bearish non-confirmation yet — just heat.
⑤ Mansfield Relative Strength

Mansfield RS versus the S&P/ASX 200 stands at +33.2% — firmly on the outperform side of zero, where it has been (with one brief dip) since March 2026 after more than a year underwater. The acceleration is the standout: a week ago the reading was +20.0 and a month ago just +2.0, so the weekly change is +13.1 points and the monthly change +31.2 points — outperformance that is both positive and speeding up. On the 2-year panel this is the strongest relative-strength posture of the entire window. Money is rotating toward this stock faster than toward the index, which is the backdrop in which breakouts to new highs have the best odds of sticking.
⑥ ATR & ADX

ADX(14) reads 33.8 — a strong-trend regime (above the 25 threshold), and it has been turning up as the breakout developed. Remember ADX measures trend strength, not direction; here it is rising alongside price, which is the constructive combination. ATR(14) is $0.095, or 3.3% of price, lifting off its July lows as the range expanded. That ATR anchors the objective risk math on this chart: the 1×ATR reference sits at $2.75 and the 2×ATR technical invalidation level at $2.66 — 6.7% below Friday's close. A daily close beneath $2.66 would say the breakout thrust has failed by this chart's own volatility yardstick, whatever the narrative.
⑦ OBV (On-Balance Volume)

OBV is in an accumulation state on both timeframes — above its 20-day average and rising, with the 90-day OBV running 46.0% above its MA20 and the 2-year series an outsized 177.3% above. On the 2-year panel OBV has climbed from deeply negative territory to fresh highs, and on the 90-day panel it pushed to a new peak alongside price — volume is confirming the move, not lagging it. There is no bearish non-confirmation here: price at new highs with OBV at new highs is what genuine demand looks like. The indicator says the rally has been bought steadily, not just marked up on air.
Bull Case
- Breakout above the three-month range and the April high $2.64; close $2.85 is just 0.7% below the 52-week high $2.87.
- Bullish MA alignment — close > SMA5 $2.69 > SMA20 $2.43 > SMA60 $2.27, all rising.
- Mansfield RS +33.2% vs the S&P/ASX 200 and accelerating: +13.1 pts on the week, +31.2 pts on the month.
- MACD golden cross (Jul 3) with the histogram still widening (+0.047).
- OBV in accumulation on both frames and making new highs with price — no volume non-confirmation.
- ADX 33.8 strong-trend regime; breakout volume 1.5x the 20-day average; no unfilled overhead gaps.
Bear Case
- RSI(14) at 81.5 — the hottest reading of the two-year window; risk-reward for fresh exposure is historically poor at this temperature.
- Close ($2.85) is above the upper Bollinger Band ($2.83) and 17.4% above SMA20 — statistically stretched.
- The last leg ran $2.44 → $2.85 in four sessions (~4 ATRs) — parabolic short-term slope invites a sharp giveback.
- The 52-week high $2.87 sits 0.7% overhead — first test of that supply after a +68% run off the February low, with plenty of holders sitting on large gains.
- Breakout volume was 1.5x average, not a 2x+ conviction spike — a stall at $2.87 on fading turnover would leave the thrust unconfirmed.
- The 2×ATR technical invalidation level $2.66 is 6.7% below — chasing here means a wide give-back to the nearest objective invalidation point.
Scenarios
| Scenario | Probability | Path | Trigger / Invalidation |
|---|---|---|---|
| Digest, then extend | 45% | A pause or shallow pullback into the $2.75–$2.69 retracement band (23.6–38.2% of the July swing) works off the RSI extreme, then price clears $2.87 for new 52-week highs. | Trigger: closes holding $2.69 or higher, then a volume-backed close above $2.87. Invalidated below $2.66 (2×ATR). |
| Overbought mean reversion | 30% | RSI 81.5 and the above-band close resolve with a sharper fade toward the breakout shelf at $2.64 (50% retracement, former April high) or $2.60 (61.8%); the larger uptrend stays intact if that zone acts as a support retest zone. | Trigger: rejection at/below $2.87 with expanding red-volume days. A daily close below $2.66 flags this path is morphing into failure. |
| Immediate extension | 25% | Strong tapes can stay overbought: price clears $2.87 without resting and enters price discovery above the two-year range, RSI pinned above 70 while RS keeps accelerating. | Trigger: a close above $2.87 on ≥2x average volume. Loses credibility if the move reverses back below $2.75 within days. |
Key Levels & Volatility References
| Price | Role | Basis |
|---|---|---|
| $2.87 | Upside resistance level | 52-week high — the only overhead reference left on the two-year chart |
| $2.85 | Current close | Fri, Jul 31 close · 0.7% below the 52-week high |
| $2.75 | Support | 23.6% retracement of the Jul 27→31 swing; coincides with the 1×ATR reference ($2.75) |
| $2.69 | Support | 38.2% retracement; SMA5 ($2.69) rising into the same zone |
| $2.66 | Technical invalidation (2×ATR) | Close − 2×ATR(14) · 6.7% below Friday's close — daily close beneath = thrust failed |
| $2.64 | Support retest zone | 50% retracement + the April 7 swing high — old resistance, now the breakout shelf |
| $2.44 | Support | Jul 27 swing low (100% retracement); SMA20 $2.43 and the Bollinger mid-band sit just beneath |
What to Watch
- $2.87 on volume. A daily close above the 52-week high on 2x+ average turnover confirms price discovery; a stall there on fading volume after an RSI-81 run is the classic exhaustion setup.
- Behaviour at $2.75–$2.69. Shallow, low-volume pullbacks that hold this retracement band would show the breakout being digested rather than distributed.
- The $2.64 shelf. The former April high is the structural line between "healthy retest" and "failed breakout" — buyers should defend it if the advance is genuine.
- RSI cooling path. Whether RSI works off 81.5 through sideways time (bullish) or through a fast price drop (bearish) tells you the character of this trend.
- Any outsized single-day move with news. A refiner's chart can gap on margin, dividend or corporate headlines — if a big candle arrives with a catalyst, weigh the fundamental driver before reading the technicals alone.