PWR Holdings
This analysis is based on closing-price data as of November 6, 2026. Whether you're researching PWR Holdings (PWH) on the ASX or learning how to read stock charts, here are objective support, resistance and technical invalidation levels built from the RSI, MACD and ATR indicators.
PWR Holdings closed at $11.14 on November 6, 10.9% below its $12.50 52-week high and 54.3% above its $7.22 52-week low. Over two years the chart has moved from a 2025 trough near $6 into a 2026 uptrend, capped so far by the Aug 21 results-period spike to $12.50 that then faded to a $9.55 close on Oct 8. The latest leg higher began with a move back above SMA60 on Oct 20 — the company's AGM day, a +6.1% session on 3.76× average volume — and the pullback toward SMA20 that this page examines formed after that event, on light volume. Relative strength versus the S&P/ASX 200 is firmly positive (+16.2%) and ADX reads a strong trend (37.1), but MACD crossed below its signal line on the basis date itself, so the short-term picture is a cooling trend rather than a fresh advance.
Snapshot as of November 6, 2026
| Item | Value | Reading |
|---|---|---|
| Close | $11.14 | −10.9% from 52w high · +54.3% from 52w low; −2.6% on the day, below the $11.62 Oct 22 close (highest close since the Aug spike) |
| 52-week range | $7.22 – $12.50 | Upper part of the range; the high is the Aug 21, 2026 intraday spike and the low dates from Dec 22, 2025 |
| SMA 5 / 20 / 60 | $11.27 / $10.98 / $10.75 | SMA5 > SMA20 > SMA60 re-formed Nov 3; close sits between SMA5 and SMA20 (+1.5% above SMA20) |
| Bollinger (20) | $12.26 / $10.98 / $9.69 | Band width 23.4% — wide after the October swing; close just above the mid line |
| aVWAP (2y anchor Feb 21, 2025) | $8.35 | Price 33% above the long-term average anchored to the Feb 21, 2025 −12.5% bar |
| aVWAP (90d anchor Aug 21, 2026) | $11.04 | Price only 0.9% above the average anchored to the Aug 21 results-period spike |
| RSI(14) | 55.4 | Cooled from 75 on Oct 22 back toward the midline; no RSI divergence on either frame |
| Mansfield RS (vs the S&P/ASX 200) | +16.2% | Outperform; −5.34 points on the week, +9.86 on the month |
| MACD (12,26,9) | 0.2690 / 0.2728 / −0.0038 | Dead cross on Nov 6, well above zero; histogram barely negative (two-year frame 0.2693 / 0.2732 / −0.0039) |
| ADX(14) | 37.1 | Strong trend reading (36.8 on the two-year frame) |
| ATR(14) | $0.370 (3.3%) | Moderate volatility; 2×ATR spans 6.6% of the share price |
| OBV (2y / 90d) | accumulation / accumulation | Above a rising MA20 on both frames (11.4% / 30.6% above MA20); no OBV divergence flagged |
| Volume vs 20d avg | 0.257× | 73,988 shares against a 287,346 average — a very light session |
| 1×ATR / 2×ATR technical invalidation | $10.77 / $10.40 | Volatility-based structural reference levels below the close |
① Price & Moving Averages
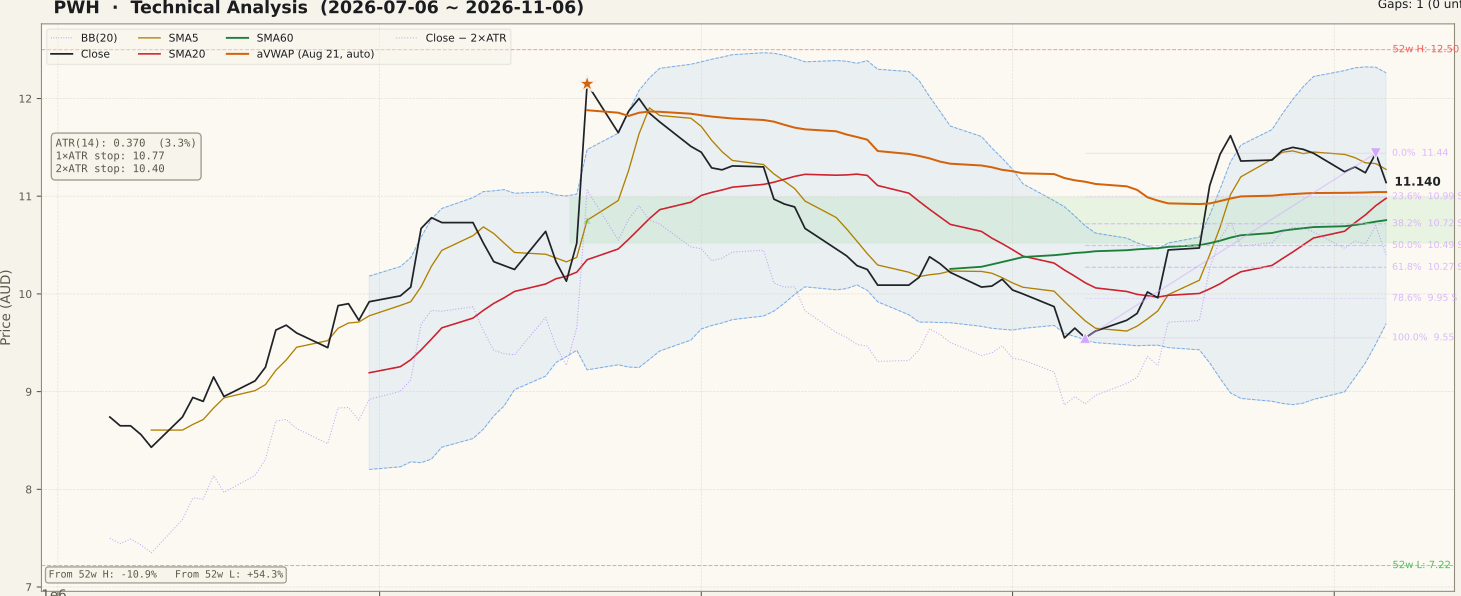
PWH_price-90d-2026-11-08.svgThe two-year frame opens near $9.30 in November 2024 and falls through early 2025: the Feb 21, 2025 session dropped −12.5% on about 8.5× average volume — the bar that anchors the two-year aVWAP ($8.35) — and the low close of the window, $6.02, came on Apr 9, 2025. A recovery through the second half of 2025 lifted price into an $8–$10 range for the first half of 2026 (high close $10.03 on Feb 27, low close $7.87 on Jun 26). From July the trend turned up again, and on Aug 21, 2026, during the FY26 results period, the share price rose +15.5% on about 3.6× volume to a $12.15 close, with an intraday high of $12.50 that remains the 52-week high. That spike faded over seven weeks to a $9.55 close on Oct 8, a −21.4% retracement from the Aug 21 close. There are no unfilled gaps on either frame.
The October recovery came in steps. MACD turned up on Oct 14 (+2.2%, 3.47× volume), the close moved back above SMA20 on Oct 16 (+4.9%, 2.35×), and on Oct 20 the close reclaimed SMA60 on the company's AGM day — the Chair and CEO addresses with an updated outlook were released that day, and the session closed +6.1% on 3.76× average volume. That bar is twelve sessions before the basis date. Price then reached an $11.62 close on Oct 22 and has eased since, making a lower close high of $11.44 on Nov 5.
The pullback structure formed after the event. The SMA5 > SMA20 > SMA60 ordering re-formed on Nov 3 on an ordinary session (+0.4%, 0.28× volume) — the previous run of that ordering, which began Jul 27, ended on Sep 9; earlier 2026 runs began Jan 15, Feb 23 and Jun 1. The close came back within 3.5% of SMA20 on Nov 6 (−2.6%, 0.26×), when RSI also cooled to 55.4. The 90-day Fibonacci swing runs from $9.55 (Oct 8) to $11.44 (Nov 5): its 23.6% level is $10.99, next to SMA20 ($10.98), and 38.2% is $10.72, next to SMA60 ($10.75). The two-year frame measures the same advance to the $11.62 Oct 22 close instead, putting its 23.6% level at $11.13, essentially at the current close.
② Volume

PWH_volume-90d-2026-11-08.svgThe tallest bars on the 90-day panel are the Aug 21 results-period session and the Aug 26 session (3.67×) that followed it, then a cluster from Oct 14 to Oct 23 around the AGM — Oct 20 at 3.76× and Oct 21–23 each above 2×. Those were up days or near-flat days, so the October recovery was carried by heavier participation.
The pullback since Oct 23 has been the reverse picture: volume has dried up. The last five sessions ran 0.31×, 0.28×, 0.42×, 0.53× and 0.26× of the 20-day average (287,346 shares), while the screened ASX universe's median ratio over the same week was a normal 0.76–1.24×. Nov 6's −2.6% close came on just 73,988 shares. A light-volume pullback is the textbook shape of a pause, but very thin volume also means individual sessions are easily moved, and the price action of a few days carries limited information on its own.
③ MACD

PWH_macd-90d-2026-11-08.svgMACD crossed above its signal line on Oct 14 from below zero, climbed above zero within days and peaked in late October. The histogram has narrowed for about two weeks, and on Nov 6 MACD (0.2690) slipped just below the signal line (0.2728), a dead cross with a histogram of only −0.0038. The cross happened well above zero, which typically marks momentum cooling inside an uptrend rather than a trend reversal. The same thing happened after the Aug 21 spike: a dead cross on Sep 2 preceded the slide to $9.55, so the reading deserves attention even though its size is marginal.
④ RSI

PWH_rsi-90d-2026-11-08.svgRSI(14) went from about 31 on Oct 8 — at the edge of oversold — to an overbought 75 on Oct 22, then eased in a series of lower readings to 55.4 on Nov 6. That reset is what a pullback within a trend is expected to look like: momentum cooled without breaking toward 40 or below. No RSI divergence is flagged on either frame. A move back through the mid-60s would show momentum returning; a slide under 50 would mean the pullback is turning into something deeper.
⑤ Mansfield RS

PWH_rs-90d-2026-11-08.svgMansfield RS versus the S&P/ASX 200 is +16.2%, above zero on both frames (outperform). It was 6.39% a month ago, so the monthly change is +9.86 points — accelerating outperformance — but it was 21.58% a week ago, so the weekly change is −5.34 points: positive but slowing. On the two-year panel RS has stayed above zero since mid-2026, peaked near the Aug 21 spike and dipped toward zero in early October before turning back up. The current reading still puts PWH well ahead of the index; the past week simply gave some of that lead back as price eased.
⑥ ATR · ADX

PWH_atr_adx-90d-2026-11-08.svgATR(14) is $0.370, or 3.3% of the share price — down from the late-August high after the results spike, and easing again after a brief rise during the AGM-week moves. The 1×ATR reference is $10.77 and the 2×ATR technical invalidation level is $10.40, 6.6% below the close. ADX(14) has risen steadily from about 20 in early October to 37.1, a strong-trend reading. ADX measures strength, not direction: here it reflects the force of the October advance, and a falling ADX in the weeks ahead would be consistent with the trend pausing.
⑦ OBV

PWH_obv-90d-2026-11-08.svgOBV is above a rising 20-day average on both frames — state "accumulation" on the two-year and the 90-day chart. On the 90-day frame OBV sits 30.6% above its MA20 (that figure measures the gap to its own average, not a divergence), after jumping with the heavy up days of mid-October and holding near its highs through the light-volume pullback. On the two-year frame the line is 11.4% above MA20 but still well below its early-2025 level, so the long-run volume balance has only partly recovered. No OBV divergence is flagged on either frame.
Bull Case vs Bear Case
Bull Case
- SMA5 > SMA20 > SMA60 re-formed on Nov 3 on an ordinary session (+0.4%, 0.28×), with SMA20 and SMA60 both rising
- Mansfield RS +16.2% versus the S&P/ASX 200, +9.86 points on the month
- ADX 37.1 — a strong-trend reading, rising since early October
- OBV above a rising MA20 on both frames; 90-day OBV near its highs
- The pullback has come on very light volume (0.26–0.53× over five sessions) in a normal market
- Price above both aVWAPs ($11.04 and $8.35); no unfilled gaps overhead or below
Bear Case
- MACD dead cross on Nov 6 — momentum cooling, as after the Sep 2 cross that preceded the slide to $9.55
- The SMA60 reclaim came on a single AGM-day bar (Oct 20, +6.1%, 3.76×), so part of the structure rests on an event session
- Lower close highs: $11.62 (Oct 22) then $11.44 (Nov 5); the $12.50 52-week high is 12.2% above
- Mansfield RS fell 5.34 points on the week
- Close below a now-falling SMA5 ($11.27)
- The last ordering run (Jul 27 – Sep 9) and the Aug 21 spike ended in a −21.4% retracement within seven weeks
Scenarios
| Scenario | Probability | Path | Trigger / Invalidation |
|---|---|---|---|
| Pause above SMA20 | 45% | Price ranges between SMA20 ($10.98) and the $11.44 Nov 5 close while MACD and RSI reset around the dead cross | Trigger: further closes inside $10.98–$11.44 on light volume. The structure holds while closes stay above the $10.40 2×ATR level |
| Trend resumes | 30% | Price clears $11.44 and the $11.62 Oct 22 close, with RS turning back up, and works toward the upper Bollinger Band ($12.26) | Trigger: a close above $11.62 on above-average volume. Invalidation: a close back below SMA20 |
| Pullback deepens | 25% | As after the Aug spike, momentum fades and price slips through SMA60 ($10.75) toward the 61.8% retracement ($10.27) and the $9.95 78.6% level | Trigger: a daily close below $10.40 (2×ATR technical invalidation) |
Key Levels & Volatility References
| Level | Role | Distance | Basis |
|---|---|---|---|
| $11.62 | Resistance | +4.3% | Oct 22 close — swing high of the two-year Fibonacci (0% of the swing); $12.50 52-week high further above |
| $11.44 | Resistance | +2.7% | Nov 5 close — swing high of the 90-day Fibonacci (0% of the swing) |
| $11.14 | Current | — | Nov 6, 2026 close; two-year 23.6% retracement ($11.13) alongside |
| $11.04 | Support | −0.9% | 90-day anchored VWAP (anchor Aug 21, 2026) |
| $10.98 | Support | −1.4% | SMA20 / Bollinger mid line; 90-day 23.6% retracement ($10.99) alongside |
| $10.75 | Support | −3.5% | SMA60 (reclaimed Oct 20); 1×ATR reference ($10.77) and 90-day 38.2% retracement ($10.72) alongside |
| $10.40 | Invalidation | −6.6% | 2×ATR technical invalidation level |
What to Watch
- SMA20 at $10.98. It is the pullback's reference line; closes holding above it on light volume keep the structure intact, while a heavy-volume break would change the read.
- The MACD dead cross. A quick re-cross above the signal line would make Nov 6 a blip; a widening negative histogram would echo the Sep 2 cross after the August spike.
- Volume on the next up day. The October advance was carried by 2–4× sessions; a move back above $11.44 would carry more weight with participation above average.
- Mansfield RS. After a −5.34-point week, stabilising above +16% would show the lead over the S&P/ASX 200 holding.
- The $10.40 level. A daily close below the 2×ATR technical invalidation level would undo the current structure.