Credit Corp Group
This analysis is based on closing-price data as of November 6, 2026. Whether you're researching Credit Corp Group (CCP) on the ASX or learning how to read stock charts, here are objective support, resistance and technical invalidation levels built from the RSI, MACD and ATR indicators.
Credit Corp Group closed at $15.64 on November 6, its highest close in the 52-week window and a fresh close above the prior 20-session closing high ($15.57, Nov 5). On the two-year chart this is the seventh month of a recovery from the $9.50 low of March 2026, with the close above SMA60 since May 7 and Mansfield RS versus the S&P/ASX 200 at +18.64% and still rising. The short-term advance has been a staircase of small 20-day-high closes (Oct 23, Oct 28, Oct 30, Nov 3, Nov 5, Nov 6) rather than one decisive bar — constructive, but ADX at 16.7 still describes a ranging market, the intraday 52-week high of $15.74 was printed and faded on the same Nov 6 session, and that latest close came on 0.91× average volume.
Snapshot as of November 6, 2026
| Item | Value | Reading |
|---|---|---|
| Close | $15.64 | Highest close in the 52-week window; above the prior 20-session closing high of $15.57 |
| 52-week high / low | $15.74 / $9.50 | −0.6% from the high (intraday, Nov 6) · +64.6% from the low |
| SMA 5 / 20 / 60 | $15.28 / $14.70 / $14.23 | Close > SMA5 > SMA20 > SMA60 — bullish stack, re-formed Oct 22 |
| Bollinger (20) | $15.61 / $14.70 / $13.78 | Close slightly above the upper band; band width 12.45% |
| aVWAP 90d (anchor Aug 4) | $13.92 | Close 12.4% above — short-term holders since the Aug 4 low in profit |
| aVWAP 2y (anchor Feb 3) | $12.41 | Close well above the long-term anchor from the Feb 3 drop |
| RSI (14) | 67.8 | Strong, just below the 70 overbought line; no divergence |
| Mansfield RS vs the S&P/ASX 200 | +18.64% | Outperforming, rising (+3.11 pts on the week, +4.11 pts on the month) |
| MACD (12,26,9) | 0.329 / 0.237 / +0.092 | Golden cross Oct 23; histogram expanding |
| ADX (14) | 16.7 (90d) · 16.4 (2y) | Ranging — trend strength not yet established |
| ATR (14) | $0.391 (2.5%) | Volatility reference for the levels below |
| OBV | 90d: accumulation, rising (+35.33% vs MA20) · 2y: early accumulation, flat (+4.32%) | Short-term volume flow firmer than the long-term picture |
| Volume | 0.91× 20-day avg | Latest close on below-average volume |
| Technical invalidation 1× / 2× ATR | $15.25 / $14.86 | Close − 1×ATR / Close − 2×ATR |
① Price & Moving Averages
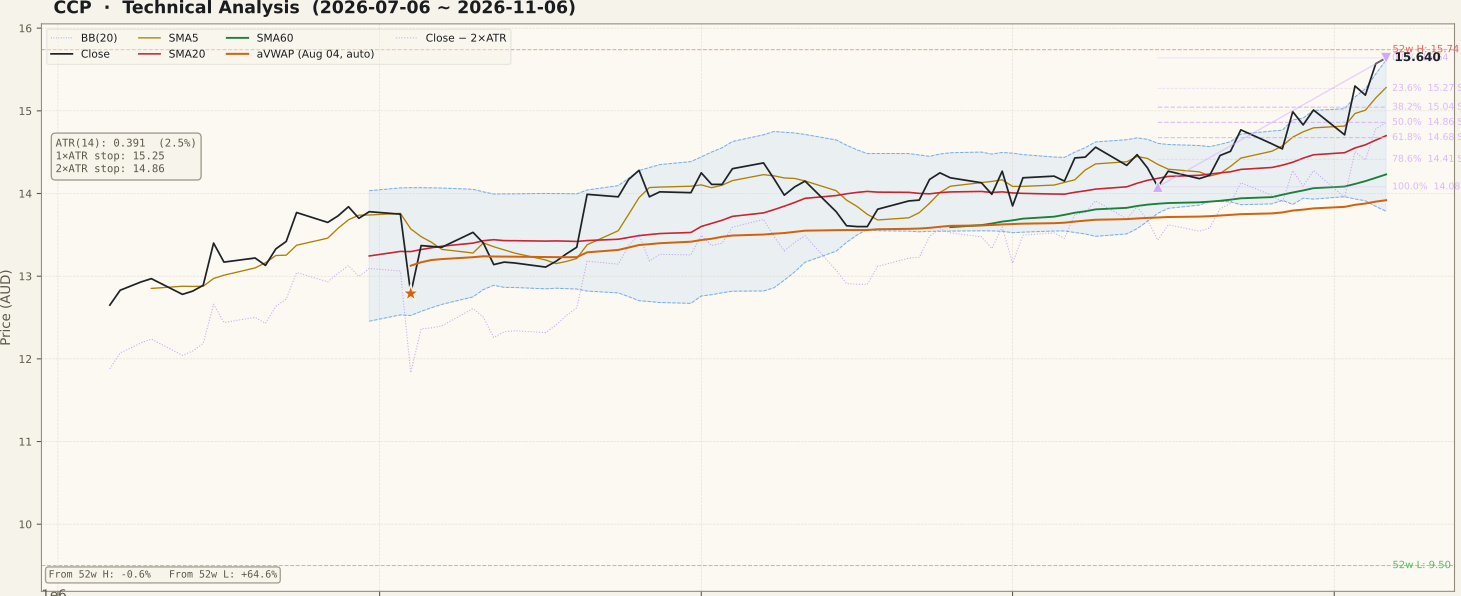
The two-year chart is a full round trip: a slide from around $18 in early 2025, a failed rally in August 2025, a −16.7% session on February 3, 2026 on roughly 8.4× average volume, and a March low at $9.50. Since then the close has stepped higher with SMA60 rising underneath it, and price has stayed above SMA60 continuously since May 7. In the last 90 sessions the moving averages fanned out again from October 22 (SMA5 $15.28 > SMA20 $14.70 > SMA60 $14.23), and the Fibonacci swing runs up from the Oct 15 low of $14.08 to the Nov 6 close of $15.64. The nearest retracement references are the 23.6% level at $15.27 (alongside SMA5 at $15.28) and the 38.2% level at $15.04, with the 50% level at $14.86 matching the 2×ATR invalidation level. The close sits just above the upper Bollinger Band ($15.61), which tends to mean either band-walking strength or a short pause; the two-year chart also shows that the August–September 2025 trading area overhead was not cleared yet. The 2y chart records two price gaps, both filled; no unfilled gaps remain.
② Volume

The latest session traded 238,578 shares against a 20-day average of 263,004 — a ratio of 0.91×. Volume picked up through the late-October and early-November steps (the Nov 3 close of +4.0% came on roughly 1.7× average and Nov 5 on roughly 1.3×), but none of the recent bars resembles the spikes on the two-year chart, and the market-wide volume backdrop for the week was ordinary. The last true volume events were the Aug 4 drop (−7.0% on roughly 7× average) and the Feb 3 drop, both well outside the last five sessions. A new closing high on below-average volume is not a failure in itself, but it is weaker confirmation than the same close on rising participation.
③ MACD

MACD sits at 0.329 against a signal line of 0.237, after a golden cross on October 23, and the histogram (+0.092) has widened over the last several sessions. Both lines are above zero, so this is a momentum re-acceleration inside an existing uptrend rather than an early turn from depressed levels. The 90-day panel also shows how choppy the September–October stretch was, with several crosses in quick succession near the signal line; the current cross is the first in that period to open a clear gap between the lines.
④ RSI

RSI(14) reads 67.8 — firm momentum just under the 70 line. No RSI divergence is flagged on either timeframe, so there is no momentum disagreement with the new closing high at this point. The last time RSI pushed above 70 on the 90-day panel was in late July, ahead of the August 4 drop; a reading above 70 is not a signal on its own, but it shortens the cushion before the advance looks stretched.
⑤ Mansfield Relative Strength

Mansfield RS versus the S&P/ASX 200 is +18.64%, up from +15.52% a week earlier and +14.53% a month earlier — positive and accelerating on both measures. On the two-year panel this is the highest relative-strength reading of the whole window, after a long stretch below zero that bottomed near −30 in March 2026. Relative strength is the clearest strength in this chart: the stock has been outperforming the index steadily since late August, independent of how choppy the absolute price path has been.
⑥ ATR & ADX

ATR(14) is $0.391, or 2.5% of price, which sets the 1×ATR reference at $15.25 and the 2×ATR technical invalidation level at $14.86. ATR has ticked up from its October lows as daily ranges widened during the November steps. ADX is 16.7 on the 90-day calculation (16.4 on the 2y), in the ranging zone below 20 — the averages are aligned and RS is rising, but directional strength has not yet built to trend-grade levels. That combination usually describes a grinding advance that can stall into sideways action without breaking down.
⑦ OBV

On the 90-day view OBV is in accumulation — above its 20-day average and rising, 35.33% above that average (a measure of distance from the MA20, not a divergence). On the two-year view the state is early accumulation with a flat slope, only 4.32% above its MA20: the large OBV build happened in June–July 2026 and has been mostly sideways since. No OBV divergence is flagged on either timeframe. Read together, short-term volume flow supports the move while the longer-term flow is neutral rather than adding fresh confirmation.
Bull Case vs Bear Case
Bull Case
- Highest close in the 52-week window ($15.64), above the prior 20-session closing high
- Mansfield RS +18.64% vs the S&P/ASX 200 and accelerating (week +3.11 pts, month +4.11 pts)
- Bullish moving-average stack re-formed Oct 22; close above SMA60 since May 7
- MACD golden cross Oct 23 with an expanding histogram, both lines above zero
- 90-day OBV in accumulation and rising; no RSI or OBV divergence
- Close well above both anchored VWAPs ($13.92 short-term, $12.41 long-term)
Bear Case
- ADX 16.7 — a ranging reading; the advance lacks trend strength
- Latest closing high on 0.91× average volume
- Intraday 52-week high of $15.74 faded to a $15.64 close on the same day
- Close above the upper Bollinger Band and RSI 67.8 — limited room before looking stretched
- Two-year OBV flat; long-term volume flow is not confirming the new high
- Higher 2025 trading levels overhead after a history of sharp single-day drops (Feb 3, Aug 4)
Scenarios
| Scenario | Probability | Path | Trigger / Invalidation |
|---|---|---|---|
| Staircase continues | 45% | Price clears the $15.74 intraday high and keeps riding the upper band with RS rising | Trigger: daily close above $15.74 with volume above average · Invalidation: close back below $15.27 |
| Pause / retest | 40% | Price consolidates or eases toward the $15.04–$15.27 Fibonacci zone while SMA20 catches up | Trigger: closes back inside the Bollinger Band without losing $15.04 · Invalidation: close below $14.86 |
| Structure fails | 15% | The staircase reverses toward SMA20/SMA60 ($14.70 / $14.23) | Trigger: daily close below the $14.86 technical invalidation level |
Key Levels & Volatility References
| Price | Role | Basis |
|---|---|---|
| $15.74 | Resistance | 52-week high (intraday, Nov 6) |
| $15.64 | Current | Nov 6 close · Fibonacci 0% of the swing |
| $15.27 | Support | Fibonacci 23.6% retracement · SMA5 $15.28 · 1×ATR $15.25 |
| $15.04 | Support | Fibonacci 38.2% retracement |
| $14.86 | Invalidation | 2×ATR technical invalidation level · Fibonacci 50% retracement |
| $14.70 | Support | SMA20 / Bollinger mid · Fibonacci 61.8% $14.68 |
| $14.23 | Support | SMA60 |
What to Watch
- Whether a daily close above the $15.74 intraday high arrives with volume above the 20-day average — the missing confirmation so far.
- ADX moving above 20: the difference between a slow grind and an established trend.
- RSI crossing 70 while price walks the upper band — strength, but with less cushion.
- Any pullback holding the $15.04–$15.27 Fibonacci zone, and SMA20 continuing to rise.
- Mansfield RS staying above +15%; a turn lower would weaken the core of the setup.