Elders
This analysis is based on closing-price data as of November 6, 2026. Whether you're researching Elders (ELD) on the ASX or learning how to read stock charts, here are objective support, resistance and technical invalidation levels built from the RSI, MACD and ATR indicators.
Over two years Elders has traded in a wide $5–$8 range, and the defining event of 2026 was the May 18 half-year results session, when the stock fell 22.9% on roughly 10.6 times average volume and left an unfilled gap between $6.42 and $7.12. Since the June 26 low of $4.96 the shares have rebuilt a rising structure, and the current setup is a pullback to the 20-day moving average: the close of $6.40 sits 1.5% above SMA20 ($6.30), and SMA5 > SMA20 > SMA60 re-aligned on the basis date itself. The lens for the next two weeks is whether price can clear the floor of that May gap while relative strength against the S&P/ASX 200 is still negative and full-year results fall due mid-November.
Snapshot as of Nov 6, 2026 close
| Item | Value | Read |
|---|---|---|
| Close | $6.40 | −17.6% from 52w high · +29.0% from 52w low |
| 52-week high / low | $7.77 / $4.96 | High Apr 9, 2026 · low Jun 26, 2026 |
| SMA5 / SMA20 / SMA60 | $6.31 / $6.30 / $6.23 | Close > 5 > 20 > 60 (re-formed Nov 6) |
| Bollinger (20, 2) | $6.54 / $6.30 / $6.06 | Width 7.61% — compressed |
| aVWAP 90d (anchor Sep 7, 2026) | $6.35 | Price slightly above — short-term holders near breakeven |
| aVWAP 2y (anchor May 18, 2026) | $5.77 | Price well above the post-results anchor |
| RSI(14) | 56.3 | Neutral-positive · no divergence flagged |
| Mansfield RS vs the S&P/ASX 200 | −4.36% | Underperform · week +1.06 pts / month −2.19 pts |
| MACD (12,26,9) | 0.0073 / −0.0026 | Golden cross Nov 5, near the zero line |
| ADX(14) | 12.6 | Ranging — no directional trend |
| ATR(14) | $0.148 (2.3%) | Moderate volatility |
| OBV (2y / 90d) | Early distribution / Early distribution | Below MA20, flat · 90d bearish divergence |
| Volume vs 20-day average | 0.75x | Quiet basis-date session |
| 1×ATR / 2×ATR technical invalidation | $6.25 / $6.10 | Volatility-based reference levels |
① Price & Moving Averages
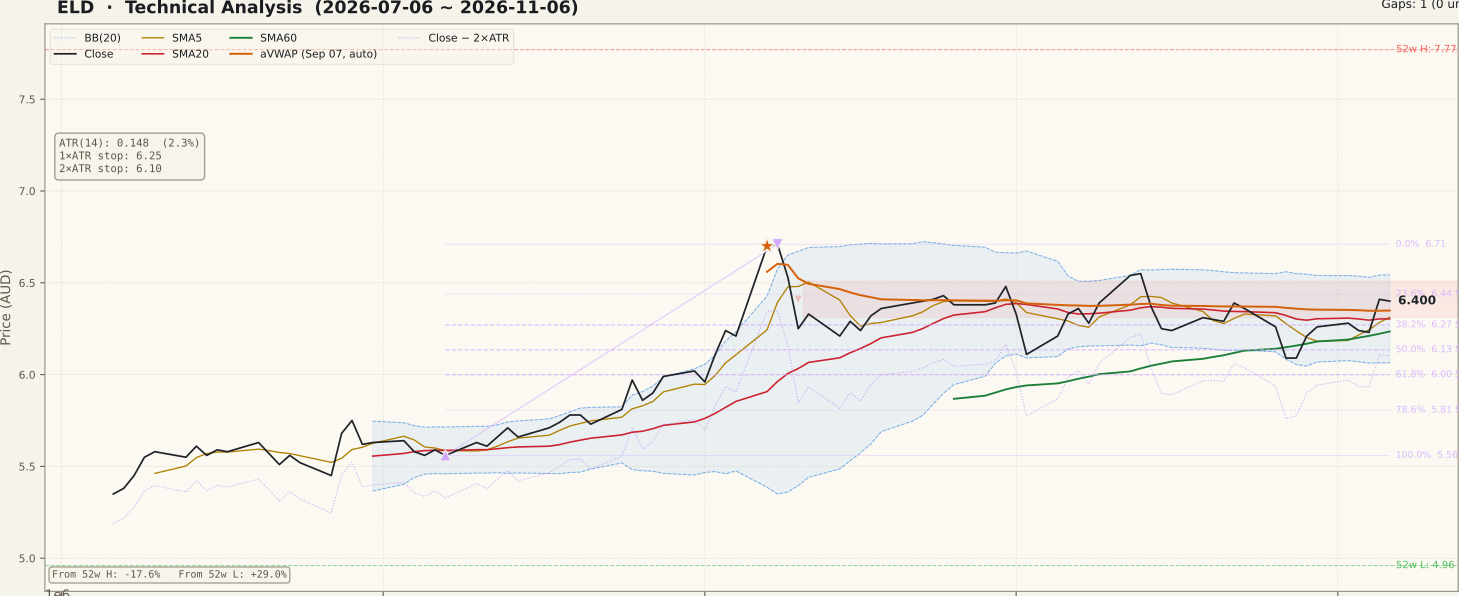
The two-year chart shows Elders recovering from the May 18 results drop: a basing phase through June and July, a September advance that peaked at $6.71 on Sep 8 (the session after a +7.9% day on 2.4 times average volume), and a sideways band between roughly $6.10 and $6.55 since mid-September. Within that band, the close of $6.40 sits 1.5% above SMA20 ($6.30), with SMA5 ($6.31) just above it and SMA60 ($6.23) rising underneath — the full SMA5 > SMA20 > SMA60 order re-formed only on Nov 6 (a −0.2% session on 0.75x volume), after a previous run from Oct 12 ended on Oct 19.
The Fibonacci grid is drawn on the Aug 7 low ($5.56) to Sep 8 high ($6.71) up-swing. The 38.2% level ($6.27) and 50% level ($6.13) sit beneath price, while the 23.6% level ($6.44) is labelled support in the data but is currently above the close, so in practice it behaves as nearby overhead. It overlaps with the floor of the unfilled May 18 gap ($6.42–$7.12), making $6.42–$6.44 the first resistance zone. Note that SMA20 itself has flattened over the past ten sessions rather than rising, which is consistent with a range rather than a trending pullback.
② Volume

Basis-date volume was 520,179 shares against a 20-day average of 693,435 — a ratio of 0.75x. The Nov 5 advance of 2.9% came on about 1.27 times average volume, a modest rather than emphatic confirmation, and no session in the last five reached twice the average. The heavy-volume clusters on this chart belong to the late-August and early-September advance and a single spike on Sep 18; since then, participation has drifted lower as price moved sideways. For a pullback structure, quiet volume on down days is a neutral-to-constructive sign, but the reverse also applies: any move through the $6.42 gap floor would need volume above average to be treated as meaningful.
③ MACD

MACD (0.0073) crossed above its signal line (−0.0026) on Nov 5, and the histogram has turned positive at 0.0099. The cross is happening essentially on the zero line after a two-month decline from the September peak, so it reads as momentum stabilising rather than a strong new impulse. The prior golden cross on Oct 13 failed the very next day, which is a reminder that crosses made at near-zero values in a ranging market are frequently short-lived. A widening histogram over the coming sessions would be the confirmation to look for.
④ RSI

RSI(14) stands at 56.3, recovering from a dip to the low 40s in late October. That is the "cooled but not broken" zone a pullback structure typically shows: well clear of overbought (it last exceeded 70 during the early-September surge) and well above oversold. No RSI divergence is flagged on either timeframe. On its own, an RSI in the mid-50s says little about direction; it mainly confirms that the recent dip did not damage momentum materially.
⑤ Mansfield Relative Strength

Mansfield RS vs the S&P/ASX 200 is −4.36%, in underperform territory. Against a week ago (−5.42%) the reading improved by 1.06 points, but against a month ago (−2.17%) it has slipped by 2.19 points — negative and improving on the week, negative and deteriorating on the month. The broader picture is a strong recovery from roughly −28% after the May results to near zero in September and October, where it stalled without crossing above the line. Until RS turns positive, Elders is keeping pace with the index rather than leading it, and a negative RS is a caution flag even when price structure looks orderly.
⑥ ATR & ADX

ATR(14) is $0.148, or 2.3% of price, down from about $0.20 at the September peak — volatility has been contracting through the range. ADX at 12.6 confirms there is no trend in force in either direction. That puts the 1×ATR reference at $6.25 and the 2×ATR technical invalidation level at $6.10, the latter sitting just above the Bollinger lower band ($6.06) and the 61.8% retracement ($6.00). Low ADX combined with a 7.61% Bollinger width describes a coiled market; the scheduled results release is the kind of event that can end such a phase abruptly, and ATR-based levels should be read with that in mind.
⑦ OBV

OBV reads "early distribution" on both timeframes: below its 20-day average with a flat slope (−5.03% from MA20 on the 90-day view, −4.84% on the two-year view — a gap measure, not a divergence). The 90-day chart also flags a bearish OBV divergence: price made a marginally higher closing peak on Nov 5 ($6.41) than on Oct 22 ($6.39), while the recorded OBV peak readings fell from 17,198,387 to 16,906,286. The two-year view shows no divergence. This is the main volume-side caution: the recovery in price over the past week has not been matched by net volume flow. A divergence is a possibility, not a verdict — it is resolved by what OBV does if price tests the $6.42 zone again.
Bull Case vs Bear Case
Bull Case
- Close > SMA5 > SMA20 > SMA60 re-formed on Nov 6, with SMA60 ($6.23) still rising.
- Price holds 1.5% above SMA20 and above the 90-day aVWAP ($6.35) after the late-October dip.
- MACD golden cross on Nov 5 with a positive histogram.
- RSI 56.3 — momentum reset without damage, far from overbought.
- Volatility contraction (ATR 2.3%, Bollinger width 7.61%) leaves a tight, well-defined range.
- Price trades well above the two-year aVWAP ($5.77) anchored at the May results low.
Bear Case
- Mansfield RS is −4.36% and deteriorated 2.19 points over the month.
- Bearish OBV divergence on the 90-day chart; OBV sits below its MA20 on both timeframes.
- The unfilled May 18 gap ($6.42–$7.12) and the $6.44 Fibonacci level sit directly overhead.
- ADX 12.6 — no trend; SMA20 has flattened rather than risen.
- Basis-date volume only 0.75x average; the Nov 5 lift came on just 1.27x.
- Full-year results expected around mid-November fall inside the two-week window — the last results session moved the stock −22.9%.
Scenarios
| Scenario | Probability | Path | Trigger / Invalidation |
|---|---|---|---|
| Range continuation | 45% | Price keeps rotating between the $6.10–$6.27 support area and the $6.42–$6.54 ceiling while ADX stays below 20. | Persists while closes stay between $6.10 and $6.44; ends on a decisive close outside either edge. |
| Upside resolution | 30% | A close above the $6.42–$6.44 zone opens the upper Bollinger band ($6.54) and the Sep 8 swing high ($6.71), inside the May gap. | Trigger: daily close above $6.44 on above-average volume. Invalidation: a return below SMA20 ($6.30). |
| Downside resolution | 25% | Loss of SMA60 ($6.23) exposes the 2×ATR level ($6.10) and the 61.8% retracement ($6.00). | Trigger: close below $6.23. Structure invalid below $6.10; results-day volatility could accelerate either path. |
Key Levels & Volatility References
| Price | Role | Basis |
|---|---|---|
| $6.71 | Resistance | Sep 8 swing high (Fibonacci 0%) — inside the May 18 gap |
| $6.54 | Resistance | Upper Bollinger band |
| $6.42 | Resistance | Floor of unfilled May 18 gap ($6.42–$7.12); Fibonacci 23.6% at $6.44 |
| $6.40 | Current | Nov 6 close |
| $6.30 | Support | SMA20 / Bollinger mid (SMA5 $6.31 just above) |
| $6.27 | Support | Fibonacci 38.2% retracement |
| $6.10 | Invalidation | 2×ATR technical invalidation level |
What to Watch
- A daily close above $6.42–$6.44 on volume above the 20-day average — the test of whether the May gap floor gives way.
- Whether OBV makes a new high alongside price, which would neutralise the current bearish divergence.
- Mansfield RS crossing above zero vs the S&P/ASX 200 — it has stalled just below the line twice since September.
- Elders' FY26 full-year results, expected around Nov 16 according to third-party calendars (prior years: Nov 17–18) — a scheduled event inside the two-week window.
- Closes below SMA60 ($6.23), which would end the re-formed moving-average alignment.