Tasmea Limited
This analysis is based on closing-price data as of August 21, 2026. Whether you're researching Tasmea Limited (TEA) on the ASX or learning how to read stock charts, here are objective support, resistance and technical invalidation levels built from the RSI, MACD and ATR indicators.
Tasmea Limited closed the week at $9.30, 7.0% under a $10.00 52-week high and 190.6% above the $3.20 low that anchors the two-year chart. That second figure describes the character of this chart better than any indicator on the page: TEA has been one of the more relentless advances on the ASX 300 board, and Mansfield relative strength has spent essentially the entire two-year window above zero, currently at +59.5%. What has changed is the tempo. Since the sharp June advance ran into the $9.48 closing high of August 14, price has moved sideways between roughly $8.05 and $9.50, and ADX has fallen to 18.1 — a ranging rather than a trending reading. The reasonable lens for this week is a high-level consolidation inside a powerful longer trend, with a freshly positive MACD on one side of the ledger and a decelerating relative-strength lead on the other.
Snapshot as of August 21, 2026
| Item | Value | Reading |
|---|---|---|
| Close | $9.30 | −7.0% from 52w high · +190.6% from 52w low |
| 52-week range | $3.20 – $10.00 | Upper end of a very wide range; the $10.00 high was reached during the June–August advance |
| SMA 5 / 20 / 60 | $9.26 / $8.85 / $8.81 | Correctly stacked with the close above all three, but the 20- and 60-day lines are only 4 cents apart — the signature of a range |
| Bollinger (20) | $9.68 / $8.85 / $8.03 | Band width 18.68%; price in the upper half, $0.38 beneath the upper band |
| aVWAP (2y anchor Nov 20, 2025) | $5.99 | Price 55.4% above — the long-horizon average cost base sits far below |
| aVWAP (90d anchor Jun 2, 2026) | $8.76 | Price above — positioning since the June 2 volume event is onside |
| RSI(14) | 56.2 | Mid-range and above the 50 pivot; a shallow bearish divergence is flagged — $9.39 at RSI 63.3 on Jul 21 versus $9.48 at RSI 61.7 on Aug 14 |
| Mansfield RS (vs the S&P/ASX 200) | +59.5% | Still a very large lead, but decelerating: −5.3 points on the week and −14.2 points on the month |
| MACD (12,26,9) | 0.1519 / 0.1028 / +0.0491 | Golden cross of Aug 12, 2026; both lines above zero and the histogram expanding |
| ADX(14) | 18.1 | Below 20 — a ranging market; the directional character of the June advance has dissipated (18.1 on the 90-day frame) |
| ATR(14) | $0.464 (5.0%) | A wide daily range — 5% of price means two ordinary sessions cover most of the current shelf |
| OBV (2y / 90d) | early accumulation / early accumulation | Both frames above their MA20 (+5.07% and +5.63%) but both slopes read flat — flow is holding, not building |
| Volume vs 20d avg | 0.69× | 325,904 shares against a 474,298 average — the week finished on light turnover |
| Unfilled gap | $6.95 – $7.12 | Support gap of Jun 2, 2026, still open well beneath the current structure |
| 1×ATR / 2×ATR technical invalidation | $8.84 / $8.37 | Volatility-based structural reference levels below the close |
① Price & Moving Averages
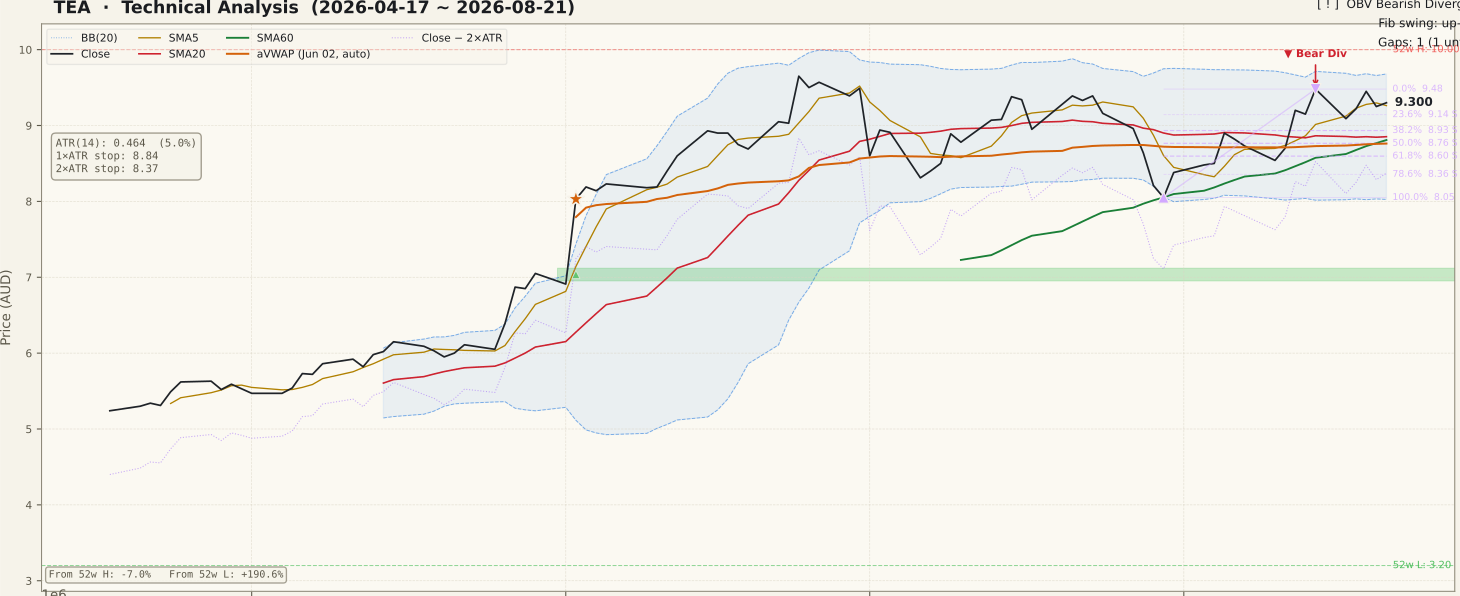
TEA_price-90d-2026-08-23.svgThe two-year frame is a staircase. Price climbed from under $2 in late 2024 to a $3.0–$3.3 shelf, drifted, then advanced through 2025 to roughly $5 by November — the session the tool selected as its long-horizon VWAP anchor. A correction through the turn of the year carried price back to the $3.20 low that now marks the bottom of the 52-week range, and from there the chart accelerates: a near-vertical run from April to June 2026 took price from around $4 to the $8s, and the $10.00 high followed. There is no ambiguity about the dominant trend on this timeframe. Tasmea completed its acquisition of the JPS Group on August 6, 2026, roughly eleven sessions before the basis date; the chart shows no gap or volume anomaly around that date, and it is noted here as background rather than as a chart event.
The 90-day window shows what happened after the run. Price gapped higher on June 2 — the origin of the unfilled $6.95–$7.12 support gap and the 90-day VWAP anchor — reached the $9.48 area by late June, and has essentially gone nowhere since. The retracement grid on this frame is measured from the $8.05 low of July 30 to the $9.48 close of August 14, and the current $9.30 sits between the 0% anchor and the 23.6% level at $9.14 — the shallowest part of the grid. The moving averages tell the same story in a different language: SMA5 $9.26, SMA20 $8.85, SMA60 $8.81. The stack is in the right order and the close is above all three, but the 20- and 60-day lines have converged to within four cents of each other, which is what happens when a market ceases to trend. Bollinger Bands span $8.03 to $9.68 at 18.68% width, with the 90-day VWAP at $8.76 sitting almost exactly on the $8.85 mid-line — a dense shelf in the $8.76–$8.93 zone that also contains the 38.2% retracement.
② Volume

TEA_volume-90d-2026-08-23.svgFriday traded 325,904 shares against a 20-day average of 474,298 — a Vol/Avg ratio of 0.69×. The 90-day panel shows the same pattern across most of August: bars consistently at or below the running average, with no single session standing out. Light turnover inside a range is unremarkable and, if anything, mildly constructive — it says the consolidation is being produced by an absence of interest rather than by a contest between supply and demand.
Two features of the wider panel deserve mention. The first is the June 2 cluster, by some margin the largest bars on the 90-day window and several multiples of the running average — the fingerprint of a news event rather than ordinary two-way trade, and the origin of both the unfilled gap and the 90-day VWAP anchor. The second is the general scale: a 474,298-share average on a stock priced above $9 makes Tasmea a moderately traded ASX small-to-mid cap rather than a deeply liquid one. That matters for how much weight the volume and OBV panels can carry here. In a name of this size a single institutional parcel can distort a day's reading, spreads widen when the market moves quickly, and a 5.0% ATR means slippage on any fast move is a real consideration rather than a theoretical one.
③ MACD

TEA_macd-90d-2026-08-23.svgMACD registered a golden cross on August 12, 2026 and it is the freshest constructive signal on the page. The line reads 0.1519 against a signal of 0.1028, with the histogram at +0.0491 and expanding. Both readings are effectively identical on the 90-day frame.
The 90-day panel gives that cross its context, and the context is favourable in one specific way. The histogram was deeply negative through July as the post-June advance unwound, bottomed in early August, and has now been positive for several bars while both lines have crossed back above zero. A cross that occurs near the zero line after a genuine reset carries more information than one that fires at the top of an extended run, because the reset removed the stretched condition that preceded it. The caveat is that MACD is a lagging, trend-following construction, and ADX is simultaneously reporting that there is no trend for it to follow. In a range, MACD crosses in both directions with some regularity and each one resolves into the middle of the band. A histogram that keeps expanding while price clears $9.48 would make this cross meaningful; one that flattens with price still inside $8.85–$9.48 was simply range noise.
④ RSI

TEA_rsi-90d-2026-08-23.svgRSI(14) reads 56.2 — mid-range, above the 50 pivot, and a long way from either extreme. A bearish divergence is flagged with both peaks identified: July 21, 2026 at price $9.39 and RSI 63.26, then August 14, 2026 at price $9.48 and RSI 61.69.
This is a case where naming the signal accurately matters more than acting on the label. The price difference between those two peaks is 1.0% and the RSI difference is 1.6 points — a divergence of the smallest possible magnitude, and one measured between two mid-range oscillator readings rather than from an overbought extreme. Compare that with the shape earlier on the 90-day panel, where RSI held above 70 for much of June and early July during the advance: those are the readings that describe real momentum. A 1.6-point slippage between two readings in the low 60s is close to indistinguishable from noise, and treating it as evidence of a top would be exactly the premature conclusion this kind of panel invites. The useful reading of RSI here is simply that it is neutral — it neither supports nor contradicts the range interpretation, and its meaning will come from whichever edge of the $8.85–$9.48 band price resolves through.
⑤ Mansfield Relative Strength

TEA_rs-90d-2026-08-23.svgMansfield RS versus the S&P/ASX 200 stands at +59.5%, one of the widest index leads this site has published, with the slope tag reading falling. Both horizons agree on direction. A week ago the reading was +64.9%, so the weekly change is −5.3 points. A month ago it was +73.8%, so the monthly change is −14.2 points. Because the reading remains firmly positive while moving toward zero, the correct description is deceleration — the lead is being consolidated, not lost. This is the positive-slowing quadrant, and it is a materially different condition from a stock whose relative strength has turned negative.
The two-year panel is the reason this page treats the deceleration as a caution rather than an alarm. Relative strength has been above zero for virtually the entire two-year window, dipping to the line only briefly around February and March 2026 before recovering. It peaked near +98% in July 2026 — the highest reading on the chart — and the current +59.5% is a retreat from that peak, not a breakdown. A lead approaching +100% is an extraordinary condition that very few stocks sustain; consolidating from it is the ordinary outcome. What would change the reading is a continued slide toward the zero line, which would say that capital has stopped rotating toward the name.
⑥ ATR & ADX

TEA_atr_adx-90d-2026-08-23.svgATR(14) is $0.464, or 5.0% of price — a wide daily range that reflects both the pace of the June advance and the modest liquidity discussed above. That figure sizes the structural reference levels on this page: 1×ATR below the close is $8.84 and the 2×ATR technical invalidation level is $8.37. A 2×ATR excursion is a 10.0% move, so $8.37 is a genuinely distant structural reference — but it lands within a cent of the 78.6% retracement at $8.36, so the volatility-derived line and the retracement grid arrive at the same place independently.
ADX(14) reads 18.1 on both frames, below the 20 threshold that separates a forming trend from a range. The two-year panel shows why that number is significant rather than merely low: ADX climbed to the mid-40s through the April–June advance and has fallen steadily since, which is the standard trajectory of a trend that has exhausted its directional impulse and handed the market back to two-way trade. The point that beginners most often invert is that ADX carries no directional information — a low reading does not mean weakness, it means indecision. Here it corroborates exactly what the price panel shows: converged 20- and 60-day lines, a three-week band, and a market waiting for a reason. The elevated ATR alongside a low ADX is the awkward combination — wide daily swings without net progress, which is the environment in which levels get breached intraday and recovered by the close.
⑦ OBV

TEA_obv-90d-2026-08-23.svgBoth timeframes report the identical configuration, which is the clearest signal-agreement on the page. On the two-year window OBV sits at 18,872,464 against a 20-day average of 17,961,511 — above the average, +5.07% divergence, early-accumulation state, flat slope. On the 90-day window it is 17,104,641 against 16,193,688, a +5.63% divergence, the same early-accumulation state and the same flat slope.
Flat is the operative word. Flow is positioned above its own average on both horizons, so nothing here contradicts the price structure, but neither series is building — which is precisely what a three-week range on below-average volume should produce. The chart tool flags both a bullish and a bearish OBV divergence inside the recent window, and rather than pick one, the honest reading is that the two flags cancelling each other is the finding: cumulative flow has no directional opinion at the moment. What would matter is the pattern this panel does not currently show — price making a new high above $9.48 while OBV visibly lags. Until price leaves the band, the OBV panel has little to add beyond confirming that no distribution is underway.
Bull Case
- Mansfield RS +59.5% vs the S&P/ASX 200 — above zero for virtually the entire two-year window, and one of the widest index leads on the board.
- MACD golden cross of Aug 12 with the histogram at +0.0491 and expanding, both lines back above zero after a genuine July reset.
- Correctly stacked moving averages — SMA5 $9.26 > SMA20 $8.85 > SMA60 $8.81 — with the close above all three.
- Price above both anchored VWAPs, $5.99 on the two-year anchor and $8.76 on the 90-day anchor, so every anchored cohort is on the right side of its average.
- OBV above its MA20 on both frames (+5.07% and +5.63%) — no distribution signature through the consolidation.
- The August give-back has reached only the shallowest part of the retracement grid, between the $9.48 anchor and the 23.6% level at $9.14.
Bear Case
- ADX 18.1 on both frames — below 20, a ranging condition; the directional impulse of the April–June advance has dissipated.
- Mansfield RS down 5.3 points on the week and 14.2 points on the month from a +73.8% reading — the lead is compressing from an extreme.
- A bearish RSI divergence is flagged, with the Aug 14 high at $9.48 and RSI 61.7 against the Jul 21 high at $9.39 and RSI 63.3.
- Friday's turnover was 0.69× the 20-day average — the range is being held on thin participation, and 474,298 shares is modest liquidity for a $9 stock.
- SMA20 $8.85 and SMA60 $8.81 have converged to within four cents, and the close is only 5.6% above the 60-day line.
- ATR at 5.0% of price means two ordinary sessions cover the entire $8.85–$9.48 shelf — level breaks in either direction carry low information here.
Scenarios
| Scenario | Probability | Path | Trigger / Invalidation |
|---|---|---|---|
| The range persists | ~45% | ADX stays beneath 20 and price continues to oscillate between the $8.76–$8.93 shelf and the $9.48 lid on below-average turnover, while the relative-strength lead continues to compress toward its longer-run average. | Trigger: continued daily closes inside $8.85–$9.48 with volume beneath the 20-day average. Invalidated by a daily close outside either edge of the band. |
| The range resolves upward | ~35% | The August 12 MACD cross carries through. Price clears the $9.48 August 14 closing high, ADX turns back above 20, and the $9.68 upper Bollinger Band and the $10.00 52-week high become the next overhead references. | Trigger: a daily close above $9.48 on above-average volume. Invalidated by a daily close below $8.85. |
| The range resolves downward | ~20% | The dense $8.76–$8.93 shelf — SMA20, SMA60, the 90-day VWAP and the 38.2% retracement — gives way. Price works toward the 78.6% level at $8.36 and the coincident $8.37 volatility line, with the $8.05 July 30 swing low beneath that. | Trigger: a daily close below $8.76 on above-average volume. Confirmed by a daily close below the 2×ATR technical invalidation level at $8.37. |
Key Levels & Volatility References
| Level | Role | Basis |
|---|---|---|
| $9.68 | Resistance | Upper Bollinger Band ($9.6795) at 18.68% band width; the $10.00 52-week high sits above it |
| $9.48 | Resistance | Aug 14, 2026 closing high and the 0% anchor of the 90-day retracement grid — the lid of the three-week range |
| $9.30 | Current close | Aug 21, 2026 close, on 0.69× average volume |
| $9.26 | Support | SMA5 ($9.262) — the first line beneath the close |
| $9.14 | Support | 23.6% retracement of the $8.05–$9.48 up-swing ($9.1425) — the shallowest level of the grid |
| $8.85 | Support | SMA20 and Bollinger mid ($8.8525), with SMA60 $8.81 and the 90-day aVWAP $8.76 immediately beneath and the 38.2% retracement at $8.93 just above — the dense shelf that defines the range floor |
| $8.37 | Invalidation | 2×ATR technical invalidation level below the close (10.0%), within a cent of the 78.6% retracement at $8.36 |
What to Watch
- The $9.48 lid — the August 14 closing high and the 0% anchor of the retracement grid. A daily close above it on above-average volume converts this consolidation into a continuation; repeated failures beneath it define a supply shelf.
- The $8.76–$8.93 shelf where the SMA20 ($8.85), SMA60 ($8.81), the 90-day anchored VWAP ($8.76) and the 38.2% retracement ($8.93) converge. This is the single most watchable zone on the chart.
- ADX at 18.1 — whether it recovers above 20, which would say a directional move has resumed, or continues to sink, which would extend the range.
- Mansfield RS versus the S&P/ASX 200 — whether the decline from +73.8% a month ago stabilises near the current +59.5%, or keeps compressing toward the zero line.
- Volume on any move out of the band. On 0.69× average turnover the range is being held by inattention; a resolution in either direction carries far more information if it arrives with above-average participation.