PDI Gold
This analysis is based on closing-price data as of October 2, 2026. Whether you're researching PDI Gold (PDI) on the ASX or learning how to read stock charts, here are objective support, resistance and technical invalidation levels built from the RSI, MACD and ATR indicators.
PDI Gold (formerly Predictive Discovery, trading as PDI Gold since September 9; the price history is adjusted for the 1-for-5 consolidation of August 26) closed at $5.10, 2.4% below its $5.23 52-week high and 108.2% above the $2.45 low. The two-year chart is a long advance from the low-$1 range in late 2024 to around $5 in the first half of 2026, a sharp June–July drawdown to a $3.05 swing low on July 17, and an August–September recovery that has now carried price back into the upper part of that range. Friday's close went just past the highest level of the prior 20 sessions and MACD crossed above its signal line on the same bar, inside an SMA5 > SMA20 > SMA60 ordering that has stood since August 21. The counterweights are a bearish RSI divergence against the September 9 peak, an ADX of 11.4 that registers no directional regime, and a breakout bar that moved only 0.39%.
Snapshot as of October 2, 2026
| Item | Value | Reading |
|---|---|---|
| Close | $5.10 | −2.4% from 52w high · +108.2% from 52w low |
| 52-week range | $2.45 – $5.23 | Close in the top of the range; the May 13, 2026 high ($5.225) is 2.4% above |
| SMA 5 / 20 / 60 | $4.874 / $4.7615 / $4.125 | Close > SMA5 > SMA20 > SMA60. Close is 4.6% over SMA5, 7.1% over SMA20 and 23.6% over SMA60 |
| Bollinger (20) | $5.128 / $4.7615 / $4.395 | Band width 15.38%; the close is 0.5% under the upper band |
| aVWAP (2y anchor May 28, 2025) | $3.61 | Price 41.2% above the long-horizon anchored average |
| aVWAP (90d anchor Aug 31, 2026) | $4.69 | Price 8.8% above the average anchored to the Aug 31 dip |
| RSI(14) | 62.8 | Firm but not overbought; bearish divergence flagged — $4.88 at RSI 67.93 on Sep 9 versus a higher $5.10 at RSI 62.76 on Oct 2 |
| Mansfield RS (vs the S&P/ASX 200) | +31.5% | Outperforming, slope rising; +10.21 points on the week and +8.68 points on the month |
| MACD (12,26,9) | 0.1691 / 0.1627 / +0.0064 | Golden cross on Oct 2 (one bar old) from well above zero; the histogram is barely positive |
| ADX(14) | 11.4 | Well below 20 — ranging, no directional regime (11.1 on the two-year frame) |
| ATR(14) | $0.238 (4.7%) | A wide daily range; 2×ATR spans 9.3% of the share price |
| OBV (2y / 90d) | early accumulation / early accumulation | Above MA20 on both frames with a flat slope; +5.97% over MA20 on the two-year frame. No OBV divergence flagged |
| Volume vs 20d avg | 1.06× | 2,427,565 shares against a 2,284,278 average; roughly 1.65× after adjusting for a quiet market (see section ②) |
| 1×ATR / 2×ATR technical invalidation | $4.86 / $4.62 | Volatility-based structural reference levels below the close |
① Price & Moving Averages
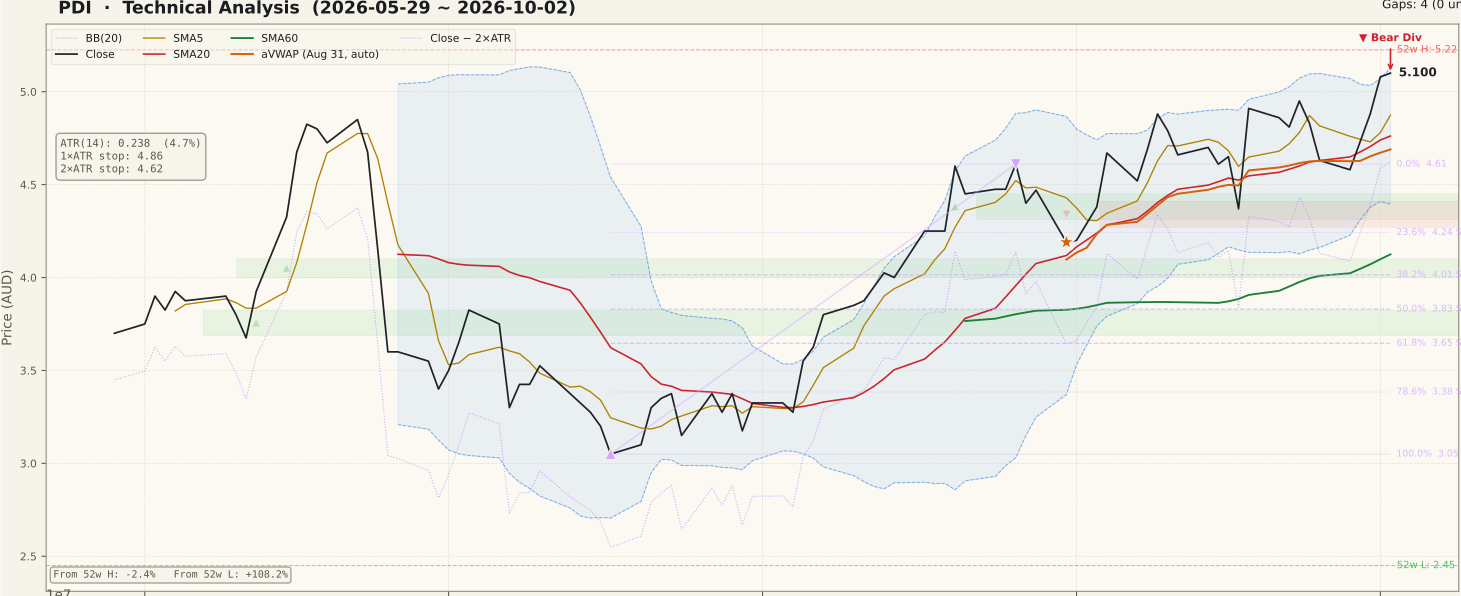
PDI_price-90d-2026-10-04.svgThe full Close > SMA5 ($4.874) > SMA20 ($4.7615) > SMA60 ($4.125) stack is in place. Each part has its own age: SMA5 has been above SMA20 since August 5, the complete SMA5 > SMA20 > SMA60 ordering since August 21, price above SMA60 since August 7, and SMA20 has been rising since September 18. The newest piece is the close above SMA20, re-established on September 29 after the late-September dip. In other words, the trend structure was built over August and early September; this week added the break, not the trend.
The break itself is thin. Friday's $5.10 close sat just above $5.095, the highest level of the prior 20 sessions (set intraday on October 1), and the bar gained only 0.39%. Price is now 0.5% under the $5.128 upper Bollinger Band and 2.4% under the $5.225 52-week high from May 13, so overhead room on the chart is short. The Fibonacci grid supplied with the chart measures the $3.05 low of July 17 to the $4.61 high of August 26; price is now 10.6% above that 0% anchor, so the grid describes the July–August leg and its levels ($4.242 at 23.6%, $4.014 at 38.2%) lie well beneath the current structure.
Both anchored VWAPs are below price — $3.61 from the May 28, 2025 anchor and $4.69 from the August 31, 2026 anchor — so on both horizons the average participant is onside. The 90-day window holds no unfilled gaps; the two open gaps on the two-year frame date from February 2025 near $1.33–$1.56 and are far below.
② Volume

PDI_volume-90d-2026-10-04.svgFriday's breakout bar traded 2,427,565 shares, 1.06× the 20-day average of 2,284,278 — an ordinary raw reading. The market around it was quiet, though: across the screened ASX universe the median volume ratio ran 0.64–0.94× during September 28 to October 2, and 0.643× on Friday itself. Read against that, PDI's turnover was roughly 1.65× the market's pace (an approximation, as the two averages are built slightly differently). That is above average, but well short of the heavy participation that usually characterises a decisive break.
The heavier session of the week was September 30, when the company released its FY26 annual results: price rose 3.17% on volume about 2.6× after the same market adjustment. On October 1 the stock added 4.10% while the S&P/ASX 200 fell 1.99% and other gold names declined (Northern Star −4.1%, Evolution −2.0%); no specific catalyst for that session was identified. Neither session reaches the size of a shock move. Earlier context, now outside the last five sessions: on September 18, the S&P/ASX quarterly rebalance trading day, PDI rose 12.36% on volume about 1.8× after adjusting for the market-wide lift that day.
③ MACD

PDI_macd-90d-2026-10-04.svgThe MACD line (0.1691) crossed above its signal (0.1627) on October 2, leaving a histogram of +0.0064 — a one-bar-old golden cross. Both lines have been above zero since August 10, so this is a cross from well inside positive territory rather than an early-stage turn. The 90-day panel shows the two lines running almost on top of each other since late August, with several crosses in both directions during September; a cross of this size has not lasted in that stretch. Widening of the histogram over the coming sessions would be what separates this one from the earlier flickers.
④ RSI

PDI_rsi-90d-2026-10-04.svgRSI(14) is 62.8 — firm, but below the 70 overbought line. A bearish divergence is flagged: price closed higher on October 2 ($5.10) than at the September 9 peak ($4.88), but RSI was lower at the second peak (62.76 versus 67.93 on the 90-day frame; 62.73 versus 67.77 on the two-year frame). The new price high therefore arrived with less upward momentum behind it than the September one. A divergence is a possibility, not a verdict — it needs price confirmation, such as a close back below the 20-day line, before it says anything about a top.
⑤ Mansfield Relative Strength

PDI_rs-90d-2026-10-04.svgMansfield RS versus the S&P/ASX 200 is +31.5% with a rising slope, identical on both frames as expected for an anchor-free measure. It is 10.21 points higher than a week ago (21.242) and 8.68 points higher than a month ago (22.767) — positive and accelerating on both comparisons. Part of the weekly gain came from the October 1 session, when the stock rose while the index fell, so the relative figure is partly a reflection of index weakness rather than only stock strength. The 90-day panel shows RS dipping below zero through most of July, recovering in August, and holding a positive lead since.
⑥ ATR & ADX

PDI_atr_adx-90d-2026-10-04.svgATR(14) is $0.238, or 4.7% of the share price. That places the 1×ATR reference at $4.86 and the 2×ATR technical invalidation level at $4.62, 9.3% below the close. ATR has eased from its mid-September level on the chart, but a 4.7% daily range still means price can cover the distance between neighbouring levels in one session. ADX is 11.4 on the 90-day frame (11.1 on the two-year frame) and has drifted lower all through the quarter. The moving-average ordering points up, while ADX says that move currently has no measurable directional strength — an orderly rise rather than a forceful one.
⑦ OBV

PDI_obv-90d-2026-10-04.svgOn-balance volume is tagged early accumulation on both frames: above its 20-day average with a flat slope. On the two-year frame OBV is 5.97% above that average and close to the top of its own range. The 90-day figure (892.75% above MA20) is not a meaningful strength reading — the 90-day OBV average is near zero (it starts the window at zero and spent July in negative territory), so any small gap becomes a very large percentage. What the 90-day panel does show is OBV climbing steadily from its July trough and turning up again over the final sessions. No OBV divergence is flagged.
Bull Case vs Bear Case
Bull Case
- Close > SMA5 > SMA20 > SMA60, with the full ordering in place since Aug 21 and SMA20 rising since Sep 18
- Close above the prior 20-session high on Oct 2, 2.4% from the $5.225 52-week high
- Mansfield RS +31.5% versus the S&P/ASX 200, +10.21 points on the week and +8.68 on the month
- MACD golden cross on Oct 2 from above zero; both lines positive since Aug 10
- Price above both anchored VWAPs — $3.61 (May 28, 2025) and $4.69 (Aug 31, 2026)
- OBV above its MA20 on both frames, early-accumulation tag, no OBV divergence
Bear Case
- Bearish RSI divergence flagged: $4.88 at RSI 67.93 on Sep 9 against a higher $5.10 at RSI 62.76 on Oct 2
- The break is thin — a 0.39% bar closing just above the prior 20-session high of $5.095
- ADX 11.4 (11.1 on the two-year frame) — no directional regime behind the move
- MACD histogram only +0.0064; September produced several crosses that did not last
- Close 0.5% under the upper Bollinger Band and 2.4% under the 52-week high — little overhead room on the chart
- ATR 4.7% of price: the 2×ATR invalidation line is 9.3% below, and the close sits 7.1% above SMA20
Scenarios
| Scenario | Probability | Path | Trigger / Invalidation |
|---|---|---|---|
| Break extends to the 52-week high | 35% | Price stays above the $5.095 prior 20-session high, the MACD histogram widens, and the $5.225 52-week high from May 13 is tested. | Trigger: a daily close above $5.23 with volume above its average. Invalidation: a daily close back below the $4.87 SMA5. |
| Break stalls into a range | 40% | ADX of 11.4 is taken at face value: price slips back under $5.10 and oscillates between the $4.76 SMA20 and the $5.13–$5.23 band, while the RSI divergence stays unresolved. | Trigger: daily closes between $4.76 and $5.23 with ADX below 20. Invalidation: a close outside either edge. |
| Divergence confirms | 25% | The bearish RSI divergence receives price confirmation: a close below the $4.76 SMA20, then the $4.69 aVWAP (Aug 31 anchor) and the $4.62 2×ATR level, with the $4.61 Fibonacci anchor just under it. | Trigger: a daily close below $4.76. Invalidation: recovery to a daily close above $5.10. |
Key Levels & Volatility References
| Level | Role | Distance | Basis |
|---|---|---|---|
| $5.23 | Resistance | +2.4% | 52-week high ($5.225, May 13, 2026) |
| $5.13 | Resistance | +0.5% | Upper Bollinger Band (20) at 15.38% band width |
| $5.10 | Current | — | Oct 2, 2026 close, just above the $5.095 prior 20-session high |
| $4.87 | Support | −4.4% | SMA5 ($4.874); the 1×ATR reference ($4.86) sits alongside |
| $4.76 | Support | −6.6% | SMA20 and Bollinger mid line ($4.7615), rising since Sep 18 |
| $4.69 | Support | −8.1% | 90-day anchored VWAP (anchor Aug 31, 2026) |
| $4.62 | Invalidation | −9.3% | 2×ATR technical invalidation level; the $4.61 Fibonacci 0% anchor (Aug 26 high) sits just beneath |
What to Watch
- Follow-through above $5.095. The break cleared the prior 20-session high by half a cent. Closes that stay above it, and a test of the $5.225 52-week high, would give the break more substance than one 0.39% bar.
- The MACD histogram. At +0.0064 it is barely positive. Widening confirms the cross; a quick slip back below the signal line would repeat September's pattern.
- RSI at the next high. A new price high with RSI above 67.93 would erase the divergence; another lower RSI reading would extend it.
- ADX through 20. At 11.4 it shows no directional regime. A turn up toward 20 would indicate the advance is gaining strength.
- The $4.76 SMA20. A daily close beneath it would be the first price confirmation of the RSI divergence.