GrainCorp
$6.43 −29.42% from the 52-week high of $9.11 · +37.10% from the 52-week low of $4.69
This analysis is based on closing-price data as of October 2, 2026. Whether you're researching GrainCorp (GNC) on the ASX or learning how to read stock charts, here are objective support, resistance and technical invalidation levels built from the RSI, MACD and ATR indicators.
Across two years GrainCorp has traced a wide arc: a slide from above $9 in late 2024, a recovery to the $9.11 52-week high area in October 2025, then a stepped decline through gaps in December 2025 and February 2026 to a base near $4.69–$5.00 in June and July 2026. From the August 14 swing low of $5.40 the price advanced 30.19% to a September 3 close of $7.03, and it has spent September in a tight band between roughly $6.50 and $6.95. The weekly screen flagged that band as a pullback: the close of $6.43 on October 2 is 3.49% beneath SMA20 but 7.69% above a rising SMA60, after two declining sessions that coincided with a broad fall in the Australian market. The momentum panels — a bearish divergence on both RSI and OBV and a MACD line below its signal since September 14 — argue that the advance has lost pace, and this page weighs that against a medium-term structure that is still intact.
Snapshot as of October 2, 2026 close
| Metric | Value | Reading |
|---|---|---|
| Close | $6.43 | −3.31% on the day; 7.35% below the 20-day closing high of $6.94 (September 9) |
| 52-week high / low | $9.11 / $4.69 | 29.42% under the high; 37.10% above the low |
| SMA5 / SMA20 / SMA60 | $6.67 / $6.66 / $5.97 | Close beneath SMA5 (−3.57%) and SMA20 (−3.49%), above SMA60 (+7.69%); SMA5 sits only half a cent above SMA20 |
| Bollinger upper / mid / lower | $6.94 / $6.66 / $6.39 | Close in the lower part of the band, 0.65% above the lower rail; width 8.24% (narrow) |
| aVWAP (2y, anchor May 14, 2026) | $5.63 | Close 14.26% above |
| aVWAP (90d, anchor Sep 2, 2026) | $6.69 | Close 3.91% below — under the average price paid since September 2 |
| RSI(14) | 48.17 (90d) / 48.15 (2y) | Just under 50; bearish divergence reported on both frames |
| Mansfield RS vs the S&P/ASX 200 | −0.11% | Underperform by a hair, slope flat; prev week 1.596, prev month −0.58 |
| MACD / signal / histogram | 0.1295 / 0.1808 / −0.0513 | Dead cross dated September 14, 2026; both lines still above zero |
| ADX(14) | 29.19 (90d) / 28.53 (2y) | Above 25 — a trending reading (strength, not direction) |
| ATR(14) | $0.1988 (3.09%) | About 20 cents of average daily range |
| OBV state | 90d distribution, falling · 2y distribution, falling | Below MA20 on both frames (−11.46% / −10.8%); bearish OBV divergence reported |
| Volume vs 20-day average | 943,335 vs 1,768,214 (0.53×) | Light; about 0.83× after adjusting for a quiet market day |
| Fibonacci swing | $5.40 (Aug 14) → $7.03 (Sep 3) | Up-swing; close sits between the 23.6% ($6.65) and 38.2% ($6.41) retracements |
| 1× / 2× ATR technical invalidation | $6.23 / $6.03 | Exact values $6.231 and $6.032; 2× sits 6.19% below the last close |
① Price & Moving Averages
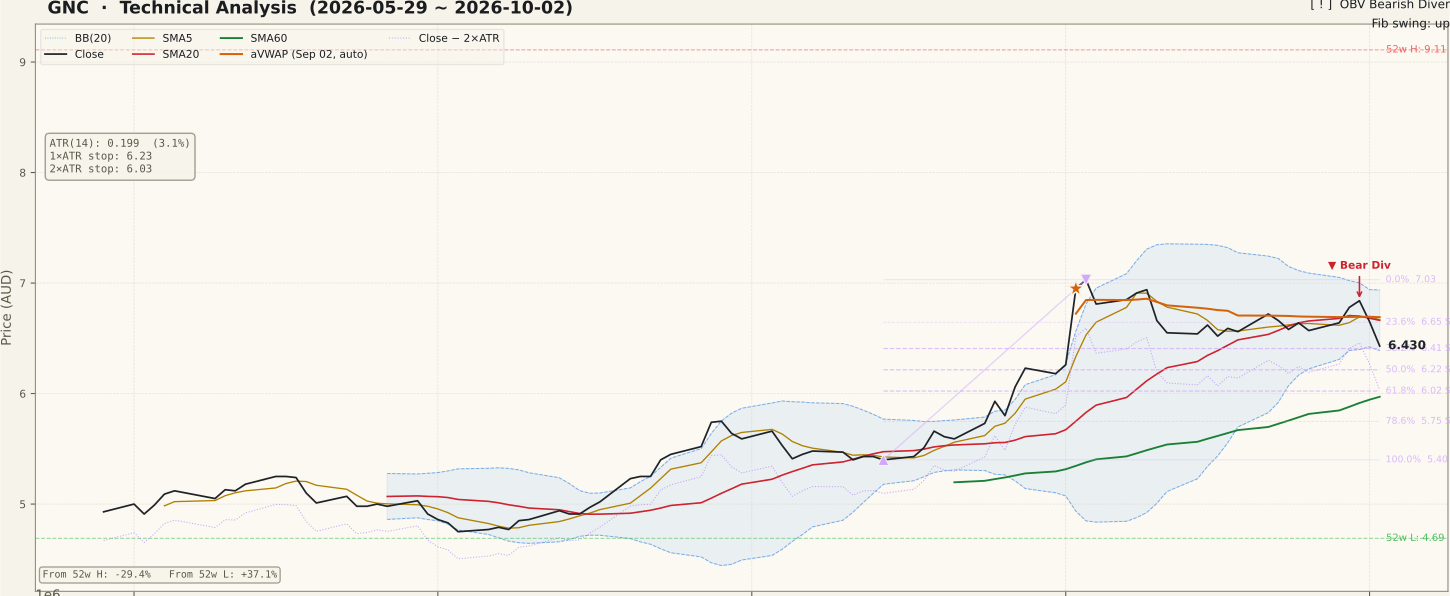
GNC_price-90d-2026-10-04.svgThe moving averages give a mixed but readable picture. SMA20 ($6.66) has been above SMA60 ($5.97) since July 31 and both are still rising, and the close has stayed above SMA60 since July 21 — the medium-term structure that carried the price off its winter base is intact. At the short end the picture is weaker: the close of $6.43 is 3.49% beneath SMA20 and 3.57% beneath SMA5, and SMA5 ($6.668) is only half a cent above SMA20 ($6.6625), having moved back above it just two sessions ago on October 1. The fast and medium averages have effectively converged, which is what a stalled advance looks like before it either resumes or rolls over.
September's range was the product of one session. On September 2 the price rose 11.02% to $6.95, and the next day's close of $7.03 is the top of the measured swing and the anchor of the 90-day VWAP. No catalyst for September 2 is identified on this page. Since then the closes have moved sideways between about $6.52 and $6.94, and the Bollinger band has narrowed to a width of 8.24%. On September 10, the day the company reconfirmed its FY26 guidance — which had pointed to sharply lower earnings amid a global grain glut — the close fell 4.03%. GrainCorp's financial year ended on September 30, so full-year results are still to come.
The Fibonacci grid runs from the August 14 low of $5.40 to the September 3 high of $7.03. The close sits just above the 38.2% retracement at $6.41 and beneath the 23.6% level at $6.65; the 50% level is $6.22 and the 61.8% level $6.02. The 90-day anchored VWAP from September 2 is $6.69, so the average participant since the September jump is now below water, while the two-year anchor from May 14, 2026 is $5.63, 14.26% beneath the close. On the two-year frame the price is also back inside an unfilled resistance gap from February 2, 2026 ($6.41–$7.17), whose lower edge coincides with the 38.2% level; a second unfilled gap sits higher at $7.66–$8.34 (December 17, 2025).
② Volume

GNC_volume-90d-2026-10-04.svgThe basis-date session traded 943,335 shares against a 20-day average of 1,768,214, a ratio of 0.53×. The market was quiet that day — the median volume ratio across the screening universe was about 0.64× — so relative to the market the reading is roughly 0.83×, somewhat below ordinary. That adjustment is approximate, because the 20-day average includes the current session. Across the five sessions from September 28 to October 2 the market median ranged between 0.64× and 0.94×, and no price or volume anomaly appeared on GNC.
The October 1 and October 2 declines (−2.78% and −3.31%) therefore came on light participation and alongside a broad market fall, with the S&P/ASX 200 down 1.99% on October 1. That is not the profile of heavy, stock-specific distribution, though it is not evidence of strong demand either. The heavier bars on this panel belong to the late-August and early-September advance, including the September 2 session.
The tallest bar, on September 18, is worth reading carefully. It was the S&P/ASX September quarterly rebalance trading day, when turnover was elevated across the whole market, and GNC's close barely moved (−0.46%). Because that session is still inside the 20-day window, it inflates the average against which every other bar is compared, so this week's ratios somewhat understate ordinary participation until it rolls out in mid-October.
③ MACD

GNC_macd-90d-2026-10-04.svgMACD reads 0.1295 against a signal line of 0.1808, with a histogram of −0.0513, and the last recorded crossover is a dead cross dated September 14, 2026. The two-year frame agrees closely (0.1289 / 0.1800 / −0.0511). The MACD line peaked in early September after the jump to $7.03 and has been drifting lower for three weeks, and the October 2 decline steepened the slope again.
Both lines remain above zero, where they have been since July 22. That distinction matters: a dead cross above zero describes momentum easing inside an existing advance, while a move of the MACD line below zero would describe the advance itself giving way. The chart is currently in the first state, with the gap to zero narrowing.
On the two-year panel, the last comparable sequence — a peak well above zero followed by a slow fade — occurred in late 2025 and resolved into the decline that began in December. That is not a forecast, but it is a reminder that a fade from a high MACD reading has resolved both ways on this chart before.
④ RSI

GNC_rsi-90d-2026-10-04.svgRSI(14) reads 48.17 on the 90-day frame and 48.15 on the two-year frame, just below the 50 midline. The JSON reports a bearish divergence on both timeframes. Its two peaks are August 19, with the price at $5.66 and RSI at 73.5 (72.8 on the two-year frame), and September 30, with the price at $6.84 and RSI at 64.36 (64.3). The price was 20.85% higher at the second peak while the oscillator was lower — a regular bearish divergence.
The divergence has already been followed by a price response: the close is 5.99% beneath the September 30 peak two sessions later. That is still not confirmation of a turn. The SMA20/SMA60 order is intact and RSI has not reached the oversold zone; a divergence describes the possibility of a turn rather than proof of one. A recovery to a new swing high with RSI back above the August reading would cancel it.
The drop below 50 is the more practical reading. Through the second half of September RSI held in the high 50s and low 60s, a range consistent with a pause inside an advance. A sustained move into the 40s would describe momentum that has shifted from pausing to fading.
⑤ Mansfield Relative Strength

GNC_rs-90d-2026-10-04.svgMansfield RS versus the S&P/ASX 200 reads −0.11% and is tagged underperform with a flat slope — in practice it is sitting on the zero line. The prior figures are absolute readings: a week ago RS stood at 1.596, so the weekly change is −1.71 and, now that the value is just below zero, the weekly quadrant is negative and deteriorating. A month ago RS stood at −0.58, so the monthly change is +0.47 and the monthly quadrant is negative but improving. The two horizons disagree, and both changes are small.
The larger story is on the two-year panel. RS spent most of 2026 deeply negative, near −30 in June and July, and recovered steeply through August to cross zero at the start of September. Since then it has run flat along the zero line: the stock went from heavy underperformance to keeping pace with the index, but not beyond it. The October 2 slip below zero came on a day when the stock fell further than the market.
A reading this close to zero carries little information on its own. What would matter is direction from here — a turn back up would show the September recovery in relative terms holding, while a slide back toward the double-digit negatives of mid-2026 would suggest it is fading.
⑥ ATR & ADX

GNC_atr_adx-90d-2026-10-04.svgATR(14) is $0.1988, or 3.09% of the last close (two-year frame $0.1989, 3.09%). The panel shows ATR jumping in early September with the gap-up session, easing through the rest of the month and turning up again with the October declines. On this scale the whole band from the $6.41 support to the $6.66 SMA20 is a little over one average session, and the 2× ATR technical invalidation level at $6.03 ($6.032) is 6.19% below the close; the 1× level is $6.23 ($6.231).
ADX(14) reads 29.19 on the 90-day frame and 28.53 on the two-year frame, above 25 and in trending territory. ADX measures strength rather than direction, and the panel shows it declining from a local high in mid-September. The reading still reflects the strength of the August advance; it is fading as the price moves sideways, and it says nothing on its own about which way the next move runs.
⑦ OBV

GNC_obv-90d-2026-10-04.svgBoth timeframes carry the same tag. On the 90-day frame OBV is 20,447,566 against an MA20 of 23,095,441, tagged distribution, below its average with a falling slope. On the two-year frame OBV is 21,880,756 against an MA20 of 24,528,631, also distribution, below and falling. The distance between OBV and its own MA20 is −11.46% (90d) and −10.8% (2y). That figure measures how far cumulative flow sits from its recent average; it is not a divergence measure.
The divergence field itself reports a bearish OBV divergence on both frames. Its peaks are September 21 (price $6.72, OBV 26,244,357 on the 90-day frame) and September 30 (price $6.84, OBV 22,131,946): the price was 1.79% higher at the second peak while OBV was lower. The chart's summary box also lists a bullish OBV divergence marker; where both occur the field resolves to bearish, and this page follows the field. RSI and OBV agree here — both report bearish divergences.
The panel shape explains the reading. OBV climbed steeply from July into mid-September, then dropped sharply in the second half of September as down days outweighed up days, and has not recovered its average since. The longer view is less severe — cumulative flow is still well above the July trough — but the recent direction is clearly lower.
Bull Case vs Bear Case
Bull Case
- SMA20 above SMA60 since July 31, both rising; the close has stayed above SMA60 since July 21 and is 7.69% above it.
- MACD line and signal both above zero since July 22 — the dead cross is an easing of momentum, not a reversal through zero.
- The October 1–2 declines came on light volume (0.53×, about 0.83× market-adjusted) and alongside a broad market fall, not a stock-specific break.
- Close sits on a shelf of support: the 38.2% retracement $6.41, the lower edge of the February 2026 gap and the lower Bollinger rail $6.39.
- Close 14.26% above the two-year anchored VWAP ($5.63); the August swing lifted the stock from its 2026 base.
- Mansfield RS recovered from near −30 in mid-2026 to the zero line; the monthly change (+0.47) is still positive.
Bear Case
- Bearish RSI divergence on both frames: August 19 $5.66 / 73.5 versus September 30 $6.84 / 64.36, with RSI now below 50 at 48.17.
- Bearish OBV divergence (September 21 vs September 30) and OBV below MA20 on both frames, tagged distribution and falling.
- MACD dead cross since September 14, histogram −0.0513, with the MACD line still sloping lower.
- Close below SMA20 (−3.49%) and the 90-day anchored VWAP $6.69 (−3.91%) — participants since September 2 are on average under water.
- Price is back inside an unfilled two-year resistance gap ($6.41–$7.17) and 29.42% under the 52-week high.
- Mansfield RS has slipped back to −0.11% (weekly change −1.71), and full-year results for a year with guided-lower earnings are still ahead.
Scenarios
| Scenario | Probability | Path | Trigger / Invalidation |
|---|---|---|---|
| The September range extends | 40% | The decline slows at the $6.41 shelf (38.2% retracement, lower gap edge, lower Bollinger rail) and the price returns to the $6.41–$6.69 zone beneath SMA20 and the 90-day anchored VWAP. The averages flatten, the narrow Bollinger band persists and the divergences resolve through time rather than price. | Trigger: closes holding above $6.41 while SMA60 keeps rising. Invalidated by a close beneath $6.23 (1× ATR). |
| Deeper retracement of the August swing | 35% | The RSI and OBV divergences lead: the close loses $6.41 and moves toward the 50% retracement at $6.22 and the 1× ATR level at $6.23, with the 61.8% level at $6.02 and the rising SMA60 near $5.97 beneath. RS would slip back into negative territory. | Trigger: a daily close beneath $6.39 (lower Bollinger rail). Technical invalidation of the structure at the 2× ATR level of $6.03. |
| Recovery of the SMA20 cluster | 25% | The two-day decline proves to be market-driven, the close recovers the $6.66–$6.69 band of SMA20, SMA5 and the 90-day anchored VWAP, and the price returns toward the $6.94 upper rail and the $7.03 swing high. MACD would need to turn back toward its signal line. | Trigger: a daily close above $6.69 on at least average turnover. Invalidated by a close back beneath $6.41. |
Key Levels & Volatility References
| Level | Role | Basis |
|---|---|---|
| $7.03 | Resistance | Swing high and 0% Fibonacci anchor (September 3 close), 9.33% above the close; the upper Bollinger rail is $6.94 |
| $6.69 | Resistance | 90-day anchored VWAP from September 2, 2026 ($6.6914), 4.07% above the close |
| $6.66 | Resistance | SMA20 and Bollinger middle band ($6.6625), 3.62% above the close; SMA5 $6.668 and the 23.6% retracement $6.65 in the same band |
| $6.43 | Current | Last close, October 2, 2026 |
| $6.41 | Support | 38.2% retracement ($6.4073) and lower edge of the February 2026 gap, 0.35% below the close; lower Bollinger rail $6.39 just beneath |
| $6.22 | Support | 50% retracement ($6.215), 3.34% below the close; the 1× ATR technical invalidation level $6.231 sits just above it |
| $6.03 | Invalidation | 2× ATR technical invalidation level ($6.032), 6.19% below the close; the 61.8% retracement $6.02 and SMA60 $5.97 sit just beneath |
What to Watch
- Whether the $6.41 shelf — the 38.2% retracement, the lower edge of the February 2026 gap and the lower Bollinger rail at $6.39 — contains the decline on a closing basis.
- Whether SMA5 crosses back beneath SMA20. The two are half a cent apart; a cross down would end the short-term alignment that formed on October 1.
- Whether OBV recovers its MA20. Both frames are tagged distribution; a return above the average would weaken the bearish OBV divergence.
- Mansfield RS around zero. A turn back above zero would show the stock keeping pace with the S&P/ASX 200; a slide lower would show the September relative recovery fading.
- Company reporting. The financial year ended September 30 and FY26 guidance pointed to sharply lower earnings; the full-year release can move the price independently of these panels.