Cuscal
This analysis is based on closing-price data as of October 2, 2026. Whether you're researching Cuscal (CCL) on the ASX or learning how to read stock charts, here are objective support, resistance and technical invalidation levels built from the RSI, MACD and ATR indicators.
Cuscal closed at $6.31 on October 2, a 3.10% gain that lifted it above its prior 20-session high and to within 0.3% of the $6.33 52-week high, 73.8% above the $3.63 low. The two-year chart is a stepped advance from about $2.30 in late 2024, with a large unfilled gap on Aug 22, 2025 and a renewed climb since April 2026. Part of the current structure was shaped by an index event: Cuscal was added to the S&P/ASX 300 in the September 2026 quarterly rebalance (announced Sep 4, rebalance trading day Sep 18, effective before the open on Sep 21), and the moving-average ordering and MACD cross formed inside that window — while the October 2 break itself came ten sessions later, on below-average volume.
Snapshot as of October 2, 2026
| Item | Value | Reading |
|---|---|---|
| Close | $6.31 | −0.3% from 52w high · +73.8% from 52w low |
| 52-week range | $3.63 – $6.33 | Close at the top of the range; the $6.33 high was the Oct 2 intraday high |
| SMA 5 / 20 / 60 | $6.14 / $5.846 / $5.430 | Close > SMA5 > SMA20 > SMA60 (full ordering since Sep 17). Close is 2.8% over SMA5, 7.9% over SMA20 and 16.2% over SMA60 |
| Bollinger (20) | $6.392 / $5.846 / $5.300 | Band width 18.68%; the close is 1.3% under the upper band |
| aVWAP (2y anchor Aug 22, 2025) | $4.75 | Price 32.7% above the long-horizon anchored average |
| aVWAP (90d anchor Aug 20, 2026) | $5.87 | Price 7.6% above the average anchored to the Aug 20 gap |
| RSI(14) | 69.0 | Just under the 70 overbought line; no RSI divergence flagged |
| Mansfield RS (vs the S&P/ASX 200) | +39.8% | Outperforming, slope rising; +4.79 points on the week and +15.85 points on the month |
| MACD (12,26,9) | 0.1913 / 0.1645 / +0.0267 | Golden cross on Sep 17, above zero since Jul 31 |
| ADX(14) | 23.4 | Trend emerging (20–25 band); 23.2 on the two-year frame |
| ATR(14) | $0.186 (2.9%) | A moderate daily range; 2×ATR spans 5.9% of the share price |
| OBV (2y / 90d) | accumulation / accumulation | Above MA20 and rising on both frames (+31.55% / +50.72% over MA20), lifted heavily by the Sep 18 bar. No OBV divergence flagged |
| Volume vs 20d avg | 0.57× | 1,122,523 shares against a 1,964,934 average; the average is inflated by the Sep 18 rebalance bar |
| 1×ATR / 2×ATR technical invalidation | $6.12 / $5.94 | Volatility-based structural reference levels below the close |
① Price & Moving Averages
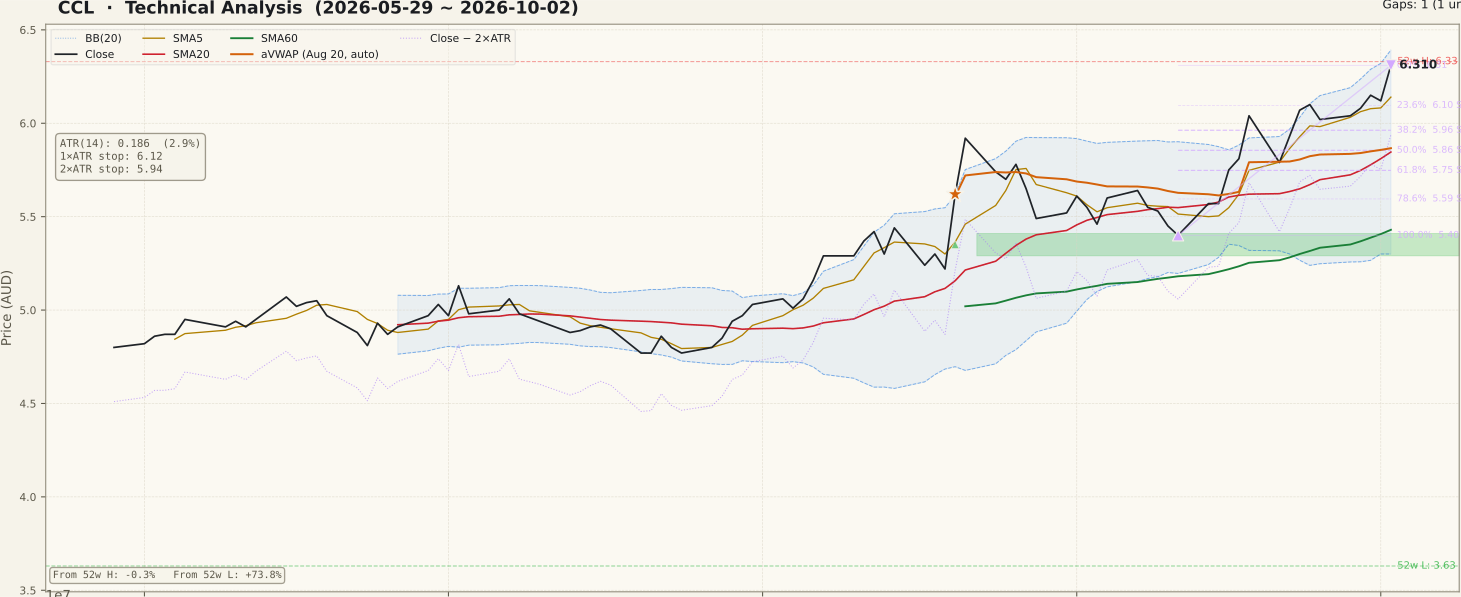
CCL_price-90d-2026-10-04.svgThe two-year frame shows a stepped advance: a base near $2.30–$2.70 in late 2024 and early 2025, an unfilled gap between $3.03 and $3.37 on Aug 22, 2025 (also the anchor of the long aVWAP at $4.75), a range around $3.80–$4.40 into early 2026, then a renewed climb from April that took price through $5 by mid-year. On the 90-day frame, an Aug 20, 2026 gap ($5.29–$5.41, still unfilled) lifted price to $5.92 within two sessions, a pullback found its low at $5.40 on Sep 11, and the advance resumed from there.
The timing of each condition matters here. The close has held above SMA60 since Jul 28 and SMA20 has been above SMA60 since Apr 20 — both predate the index event. But the close moved back above SMA20 on Sep 16, SMA5 crossed above SMA20 on Sep 17 (completing the full SMA5 > SMA20 > SMA60 ordering), and SMA20 has been rising only since Sep 14 — all inside the Sep 4 to Sep 18 inclusion window. After the Sep 18 rebalance bar, closes held in a band of roughly $5.79–$6.15 for nine sessions; the Oct 2 close of $6.31 cleared that band and the prior 20-session high.
The Fibonacci swing runs from the $5.40 low (Sep 11) to the $6.31 high (Oct 2): the 23.6% retracement is $6.10, 38.2% is $5.96 and 50% is $5.86, the last sitting almost on SMA20 ($5.846) and the 90-day aVWAP ($5.87). The close is 1.3% under the upper Bollinger Band at a band width of 18.68%.
② Volume

CCL_volume-90d-2026-10-04.svgThe tall bar in the panel is Sep 18, the S&P/ASX 300 rebalance trading day: CCL rose 3.96% on volume about 22.9 times its 20-day average, while the median ASX stock in the screened universe traded about 2.23 times its own average that day. Adjusted for the market, that is roughly ten times normal participation — index-inclusion flow rather than an ordinary breakout bar.
The Oct 2 break was different. Volume was 1,122,523 shares, 0.57× the 20-day average. The universe median that day was 0.643×, so on a market-adjusted basis the bar ran at roughly 0.89× — approximate, because the 20-day average includes the current day. Note also that the Sep 18 bar sits inside the 20-day window and inflates the average, which makes every recent ratio look smaller. Even allowing for that, the break did not come with a participation surge. Across Sep 28 – Oct 2 the market as a whole was quiet (universe median 0.64–0.94×).
③ MACD

CCL_macd-90d-2026-10-04.svgThe MACD line is 0.1913 against a signal of 0.1645, a histogram of +0.0267. Both lines have been above zero since Jul 31. The most recent golden cross printed on Sep 17, the day before the rebalance bar, after a dead cross in early September had pulled the histogram negative. Since the cross the histogram has stayed positive and the MACD line has turned up again toward its late-August peak. A cross well above zero is a continuation signal within an existing uptrend rather than an early-turn signal.
④ RSI

CCL_rsi-90d-2026-10-04.svgRSI(14) is 69.0, just below the 70 line. On the 90-day chart it briefly moved above 70 in mid-August and has otherwise stayed between the midline and 70, dipping toward 50 around the Sep 11 low. No RSI divergence is flagged in the data. A reading near 70 alongside a fresh 20-day high is typical of a strong advance, but it also leaves little room before the indicator sits in overbought territory — a stretched reading is not, by itself, a reversal signal.
⑤ Mansfield Relative Strength

CCL_rs-90d-2026-10-04.svgMansfield RS vs the S&P/ASX 200 is +39.8%, outperforming with a rising slope. A week earlier it was +35.01 and a month earlier +23.95, so it gained 4.79 points on the week and 15.85 points on the month — positive and accelerating on both horizons. On the two-year chart RS has stayed above zero almost throughout, and the current reading is at the top of that history. Some of the September gain coincides with the inclusion window, but RS kept rising into Oct 2, after the rebalance flow had passed.
⑥ ATR & ADX

CCL_atr_adx-90d-2026-10-04.svgATR(14) is $0.186, or 2.9% of price, which places the 1×ATR reference at $6.12 and the 2×ATR technical invalidation level at $5.94, 5.9% below the close. ATR spiked after the Aug 20 gap, eased through September and has edged up again since mid-month. ADX is 23.4 (23.2 on the two-year frame) — in the 20–25 band where a trend is forming but not yet strong. ADX measures strength, not direction; a move above 25 would indicate the advance is gaining persistence.
⑦ OBV

CCL_obv-90d-2026-10-04.svgOBV is tagged accumulation on both frames — above its MA20 and rising — at +31.55% over MA20 on the two-year frame and +50.72% on the 90-day frame. These percentages measure distance from the moving average, not divergence. The reading needs context: most of the gap opened in a single step on Sep 18, when the rebalance volume landed on an up day, so a large share of the OBV strength traces to one index-driven session. Since then OBV has continued to edge higher on ordinary volume. No OBV divergence is flagged.
Bull Case vs Bear Case
Bull Case
- Close above the prior 20-session high on Oct 2, 0.3% under the $6.33 52-week high
- Full SMA5 > SMA20 > SMA60 ordering; SMA20 above SMA60 since Apr 20 and close above SMA60 since Jul 28
- Mansfield RS +39.8% vs the S&P/ASX 200, +4.79 points on the week and +15.85 on the month
- MACD above zero since Jul 31 with a golden cross on Sep 17 and a positive histogram
- Price above both anchored VWAPs — $4.75 (Aug 22, 2025) and $5.87 (Aug 20, 2026)
- The break came ten sessions after the rebalance, after a nine-session hold in the $5.79–$6.15 band
Bear Case
- Break volume 0.57× average (about 0.89× market-adjusted) — no participation surge
- The MA ordering, MACD cross and 52-week-high proximity formed inside the index-inclusion window
- OBV strength traces largely to one index-driven bar (Sep 18, ~22.9× volume)
- RSI 69.0, a step from overbought; close 7.9% over SMA20 and 1.3% under the upper band
- ADX 23.4 — trend still forming, not established
- The $6.33 52-week high is immediately overhead; the 2×ATR level is 5.9% below
Scenarios
| Scenario | Probability | Path | Trigger / Invalidation |
|---|---|---|---|
| Break extends past the 52-week high | 35% | Price clears $6.33 and the upper band near $6.39 widens with it, extending the advance beyond the post-inclusion band | Trigger: daily closes above $6.33 with volume returning to or above its 20-day average. Invalidation: a close back inside the $5.79–$6.15 band |
| Retest of the post-inclusion band | 45% | Having broken on light volume, price drifts back toward $6.10–$6.15 (23.6% retracement and band top) and consolidates while RSI cools | Trigger: closes back below SMA5 ($6.14). Holds the structure while closes stay above the $5.94 2×ATR level |
| Break fails into a deeper pullback | 20% | Price falls back through the band toward SMA20, the 90-day aVWAP and the 50% retracement around $5.85–$5.87 | Trigger: a daily close below $5.94 (2×ATR technical invalidation). The Aug 20 gap at $5.29–$5.41 sits further below |
Key Levels & Volatility References
| Level | Role | Distance | Basis |
|---|---|---|---|
| $6.39 | Resistance | +1.3% | Upper Bollinger Band (20) at 18.68% band width |
| $6.33 | Resistance | +0.3% | 52-week high (Oct 2, 2026 intraday) |
| $6.31 | Current | — | Oct 2, 2026 close, above the prior 20-session high |
| $6.14 | Support | −2.7% | SMA5; the $6.15 top of the post-inclusion closing band and the 1×ATR reference ($6.12) sit alongside |
| $6.10 | Support | −3.4% | Fibonacci 23.6% retracement of the Sep 11 – Oct 2 swing |
| $5.94 | Invalidation | −5.9% | 2×ATR technical invalidation level; the 38.2% retracement ($5.96) sits just above |
| $5.85 | Support | −7.4% | SMA20 / Bollinger mid line ($5.846), with the 50% retracement ($5.855) and 90-day aVWAP ($5.87) clustered |
What to Watch
- Volume on follow-through. The Oct 2 break ran at 0.57× average. A move through $6.33 on volume at or above the 20-day average would show participation that does not depend on the index event. Remember the Sep 18 bar will drop out of the 20-day average in late October, which will lift the ratios mechanically.
- The $6.15 band top. Closes that stay above the top of the post-inclusion band keep the break intact; a slip back inside it would mean the break did not hold.
- RSI through 70. At 69.0 it is on the line. Strength above 70 is common in trends; a new price high with a lower RSI would be the first sign of divergence.
- ADX above 25. At 23.4 the trend is forming. A rise through 25 would show the advance gaining persistence.
- The $5.94 level. A daily close below the 2×ATR technical invalidation level would undo the post-break structure.