Dicker Data
$16.07 −1.53% from the 52-week high of $16.32 · +94.08% from the 52-week low of $8.28
This analysis is based on closing-price data as of October 9, 2026. Whether you're researching Dicker Data (DDR) on the ASX or learning how to read stock charts, here are objective support, resistance and technical invalidation levels built from the RSI, MACD and ATR indicators.
Over two years Dicker Data spent most of 2025 inside an $8–$11 band, broke down toward the 52-week low of $8.28 in March 2026, and has since climbed in three steps: a sharp June repricing, a near-vertical results gap on August 28, and a steady grind through September and October to a $16.07 close — the highest close of the past year and 1.53% under the $16.32 intraday 52-week high printed on October 7. This week also carried a corporate event: after a trading halt on October 6, Dicker Data announced on October 7 that it is acquiring Sektor Group for A$111.5m. The breakout bucket's defining condition — fresh 20-day-high closes — had already printed on September 24, October 1 and October 5, before the announcement; the MACD golden cross is dated the announcement day itself. The trend is strong (ADX 44.33) and relative strength is high and rising, but RSI sits at 71.64 with a bearish divergence recorded against the August 28 peak.
Snapshot as of October 9, 2026 close
| Metric | Value | Reading |
|---|---|---|
| Close | $16.07 | Highest close of the past 52 weeks; +1.84% on the session |
| 52-week high / low | $16.32 / $8.28 | The high is the October 7 intraday print (announcement day); close 1.53% beneath it |
| SMA5 / SMA20 / SMA60 | $15.74 / $15.1465 / $13.7848 | SMA5 > SMA20 > SMA60; close +2.10% / +6.10% / +16.58% above them |
| Bollinger upper / mid / lower | $16.1355 / $15.1465 / $14.1575 | Close at the upper rail (0.41% beneath it); width 13.06% |
| aVWAP (2y, anchor Aug 29, 2025) | $10.6317 | Close 51.15% above |
| aVWAP (90d, anchor Aug 28, 2026) | $14.8897 | Close 7.93% above the results-gap day's average cost |
| RSI(14) | 71.64 (90d) / 71.65 (2y) | Above 70; bearish divergence vs the August 28 peak (78.65) |
| Mansfield RS vs the S&P/ASX 200 | +48.27% | Outperform, rising (prev week 45.85, prev month 33.40) |
| MACD / signal / histogram | 0.4982 / 0.4704 / 0.0278 | Golden cross dated October 7, 2026 (announcement day); histogram thin |
| ADX(14) | 44.33 (90d) / 44.45 (2y) | Strong trend on both frames |
| ATR(14) | $0.4104 (2.55%) | About 41 cents of average daily range |
| OBV state | 90d accumulation, rising · 2y early accumulation, flat | Above MA20 on both frames; no OBV divergence reported |
| Volume vs 20-day average | 471,007 vs 486,292 (0.969×) | Ordinary in isolation; about 1.31× after adjusting for a quiet market (ASX median 0.74× that day) |
| Fibonacci swing (90d) | $14.97 (Sep 28) → $16.07 (Oct 9) | Up-swing; 23.6% at $15.81, 38.2% at $15.65, 61.8% at $15.39 |
| 1× / 2× ATR technical invalidation | $15.66 / $15.25 | Exact $15.66 and $15.249 (90d); 2× sits 5.11% below the close |
① Price & Moving Averages
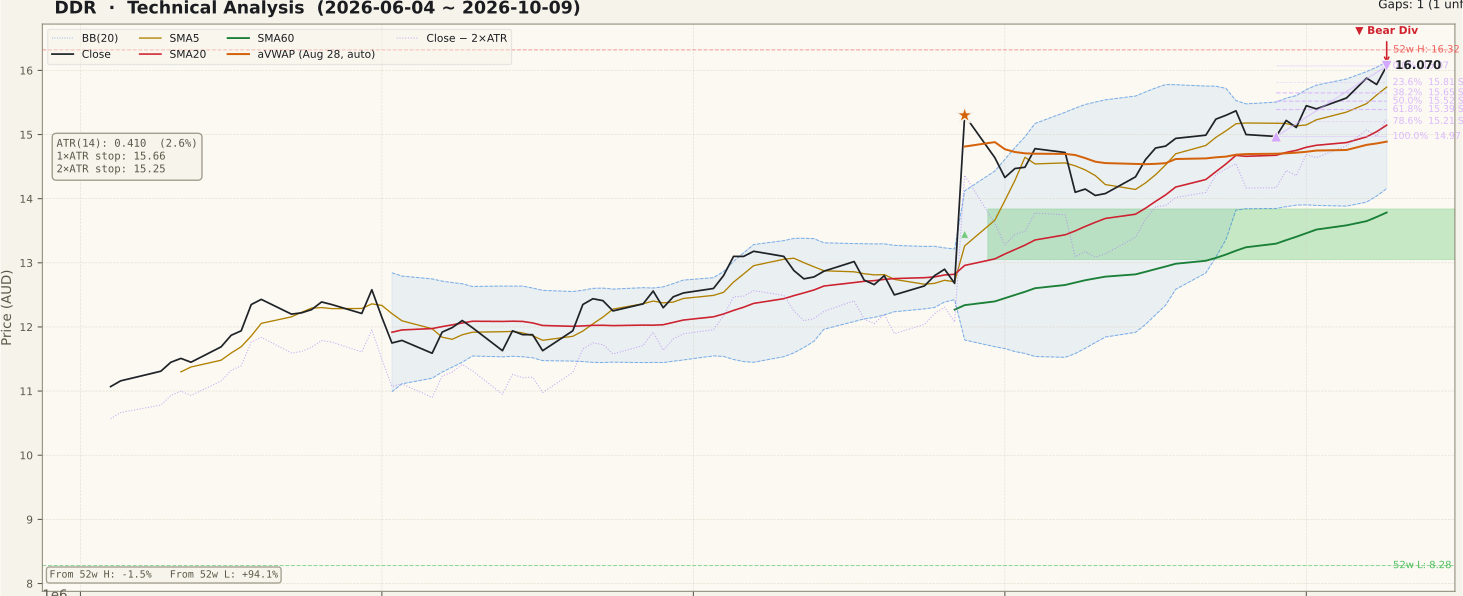
DDR_price-90d-2026-10-11.svgThe 90-day panel is a staircase. A flat $11.6–$12.4 band through July gave way to a slow August climb, then the August 28 full-year results session gapped the stock higher (+20.66% on 3.69× volume) and left an unfilled gap between $13.05 and $13.84 that still sits beneath the price as support. That same session is when the close moved above SMA20 and SMA60 and SMA5 > SMA20 > SMA60 fell into rising order — six weeks ago and outside this week's window, so it is recorded here as history rather than as a fresh shock (SMA20 has been above SMA60 since May 13).
Since late September the price has walked up the upper Bollinger rail: 20-day-high closes printed on September 24, October 1 and October 5, all before the October 6 halt, and again on October 7 and October 9. The October 7 announcement session spiked intraday to $16.32 but closed at $15.88, 44 cents off the high; Friday's $16.07 close is now 0.41% beneath the upper rail ($16.1355). Price is 6.10% above SMA20 and 16.58% above SMA60 — well extended from the mean, which is the normal shape of a strong trend but leaves room for a pause toward SMA5 ($15.74) or SMA20 ($15.15).
② Volume

DDR_volume-90d-2026-10-11.svgFriday's 471,007 shares were 0.969× the 20-day average of 486,292. Read alone that is an ordinary session, but the ASX was quiet all week — the universe median volume ratio ran 0.45×, 0.71×, 0.81×, 0.79× and 0.74× from October 5 to 9 — so relative to the market Friday's break came on roughly 1.31× participation: above average, not emphatic. The tallest bar of the week is October 7, the acquisition announcement day, at 2.54× average (about 3.12× market-adjusted) on a +1.99% close. The panel shows no bar on October 6, the halt day. The heaviest volume clusters of the quarter belong to late August around the results gap.
③ MACD

DDR_macd-90d-2026-10-11.svgMACD (0.4982) is back above its signal line (0.4704) after a golden cross dated October 7, 2026 — the acquisition announcement day, so this signal formed on the event session rather than ahead of it. The cross occurs far above zero, which marks continuation within an established up-trend rather than an early turn. The histogram is thin at +0.0278, and the lines have been braided near 0.45–0.50 since mid-September with several crosses in both directions, so momentum is positive but not expanding; the late-August MACD peak has not been exceeded.
④ RSI

DDR_rsi-90d-2026-10-11.svgRSI(14) is 71.64, just inside overbought territory. Both frames record a bearish divergence: the first peak on August 28, 2026 at a $15.30 close with RSI 78.65, the second on October 9, 2026 at $16.07 with RSI 71.64 — a higher price on a lower RSI. That says the latest leg has carried less momentum than the results-day surge. A divergence is a possibility of a top, not a confirmation; in strong trends RSI can stay above 70 for weeks, and a later high with RSI above 78.65 would cancel the pattern.
⑤ Mansfield Relative Strength

DDR_rs-90d-2026-10-11.svgMansfield RS vs the S&P/ASX 200 is +48.27%, the highest reading on the two-year panel and rising. Against the prior week (45.85) that is +2.41, and against the prior month (33.40) +14.87 — positive and accelerating on both horizons. The line has been above zero continuously since June 2026; the step-up came with the August results gap and the line has kept climbing since rather than giving it back. Relative strength is the steadiest pillar of this chart.
⑥ ATR & ADX

DDR_atr_adx-90d-2026-10-11.svgADX is 44.33 (90d) and 44.45 (2y), well above 25 — a strong trend, and the line is edging higher into October. ADX measures strength, not direction; here the direction is up. ATR(14) is $0.4104, 2.55% of price. It spiked with the August gap, decayed through September, and has ticked back up this week with the announcement-day range. On these numbers the 1× ATR reference sits at $15.66 and the 2× ATR technical invalidation level at $15.25, 5.11% below the close.
⑦ OBV

DDR_obv-90d-2026-10-11.svgOn the 90-day frame OBV is in accumulation — above its MA20 by 10.62% and rising — and it reached a new panel high this week alongside price, so volume flow confirms the latest leg. On the two-year frame OBV is in early accumulation: above its MA20 (53.95% gap to the average) but flat in slope, still recovering from a large step down in August 2025. No OBV divergence is recorded on either frame (field null), so the bearish divergence on this chart is an RSI story only.
Bull vs Bear
Bull Case
- Highest close of the past 52 weeks ($16.07), 1.53% under the $16.32 intraday high
- 20-day-high closes on September 24, October 1 and October 5 — the breakout condition formed before the October 7 announcement
- SMA5 > SMA20 > SMA60 with close 6.10% over SMA20 and 16.58% over SMA60
- Mansfield RS +48.27% vs the S&P/ASX 200, accelerating (+2.41 week, +14.87 month)
- ADX 44.33 — strong trend, edging higher
- OBV above MA20 on both frames, 90d rising to a new panel high; no OBV divergence
Bear Case
- Bearish RSI divergence: Aug 28 $15.30 / RSI 78.65 vs Oct 9 $16.07 / RSI 71.64
- RSI 71.64 above 70 and close at the upper Bollinger rail ($16.14)
- MACD golden cross dated the announcement day; histogram only +0.0278 and below the August peak
- October 7 closed 44 cents off its $16.32 spike high — the high has not been reclaimed
- Friday volume 0.969× average (about 1.31× market-adjusted) — participation modest, not emphatic
- Extended 16.58% above SMA60; the August gap support ($13.05–$13.84) is far below
Scenarios
| Scenario | Probability | Path | Trigger / Invalidation |
|---|---|---|---|
| Trend continuation through the 52-week high | 40% | Price keeps riding the upper Bollinger rail and clears the $16.32 announcement-day high, with RS and OBV extending | Trigger: a daily close above $16.32 on market-adjusted volume above average; a new high with RSI above 78.65 would also cancel the divergence |
| Pause and consolidation | 35% | RSI cools from above 70 while price rotates between the $15.65–$15.81 retracement zone and $16.32, letting SMA20 catch up | Confirmed by closes inside roughly $15.65–$16.32 with ADX flattening; ends on a decisive close outside the range |
| Deeper pullback | 25% | The RSI divergence resolves lower; price loses SMA5 ($15.74) and the 38.2% level ($15.65) and tests the $15.25 2× ATR level, with SMA20 ($15.15) and the 90d aVWAP ($14.89) beneath | A close below $15.249 (2× ATR) would say the October leg has failed; the $14.97 swing low is the next structural reference |
Key Levels & Volatility References
| Price | Role | Basis |
|---|---|---|
| $16.32 | Resistance | 52-week high — the October 7 announcement-day intraday spike, 1.56% above the close |
| $16.14 | Resistance | Upper Bollinger rail ($16.1355), 0.41% above the close |
| $16.07 | Current | Close, October 9, 2026 (Fibonacci 0% of the Sep 28–Oct 9 up-swing) |
| $15.81 | Support | 23.6% retracement ($15.8104), 1.62% below; SMA5 $15.74 just beneath |
| $15.66 | Support | 1× ATR reference, with the 38.2% retracement ($15.65) at the same spot |
| $15.25 | Invalidation | 2× ATR technical invalidation level ($15.249), 5.11% below; 78.6% retracement $15.21 and SMA20 $15.15 just beneath |
| $14.89 | Support | 90d anchored VWAP from August 28 ($14.8897); swing low $14.97 just above |
What to Watch
- The $16.32 announcement-day high: a close above it would turn the October 7 spike from a rejection into a base; repeated failures beneath it would make it a ceiling.
- RSI on the next high — above 78.65 cancels the bearish divergence; another higher price on a lower RSI extends it.
- Market-adjusted volume: the breakout has come on modest participation in a quiet market; expansion on up days would strengthen the case.
- The $15.65–$15.81 retracement zone and SMA5 at $15.74 — the first structure beneath the price.
- Any further disclosure on the Sektor Group acquisition (terms, funding, completion), which sits behind this week's volume and the MACD cross.