4dmedical
This analysis is based on closing-price data as of October 9, 2026. Whether you're researching 4dmedical (4DX) on the ASX or learning how to read stock charts, here are objective support, resistance and technical invalidation levels built from the RSI, MACD and ATR indicators.
4dmedical closed at $4.05, 46.4% below its $7.55 52-week high and 189.3% above the $1.40 low. On the two-year chart the stock advanced from a sub-$1 base in mid-2025 to a peak in April 2026, fell back sharply in May, and has since moved sideways in a broad range of roughly $3 to $4.70 — so the larger picture is a range, not an advance. Inside that range, a September 8 to September 18 swing from $3.35 to $4.31 put the SMA5 > SMA20 > SMA60 ordering in place on September 30, and the past week has been a pullback from the $4.36 close of October 1 back to the 20-day line. Friday's close re-took both SMA20 and SMA60 on quiet volume, while a fresh MACD dead cross, a bearish RSI divergence and an ADX of 16.0 temper the read; on the other side, OBV shows a bullish divergence at the pullback low.
Snapshot as of October 9, 2026
| Item | Value | Reading |
|---|---|---|
| Close | $4.05 | −46.4% from 52w high · +189.3% from 52w low |
| 52-week range | $1.40 – $7.55 | Close in the middle of the range, far below the high |
| SMA 5 / 20 / 60 | $4.026 / $4.013 / $3.794 | Close > SMA5 > SMA20 > SMA60, ordering in place since Sep 30. Close is only 0.9% above SMA20 and 6.7% above SMA60 |
| Bollinger (20) | $4.491 / $4.013 / $3.535 | Band width 23.8%; the close sits just above the mid line, 9.8% below the upper band |
| aVWAP (2y anchor Aug 1, 2025) | $3.354 | Price 20.8% above the long-horizon anchored average |
| aVWAP (90d anchor Jul 17, 2026) | $3.830 | Price 5.7% above the average anchored to the July low |
| RSI(14) | 53.0 | Neutral; bearish divergence flagged — $4.31 at RSI 63.92 on Sep 18 versus a higher $4.36 at RSI 62.96 on Oct 1 |
| Mansfield RS (vs the S&P/ASX 200) | +11.9% | Outperforming, slope rising; −9.69 points on the week (slowing), +14.77 points on the month |
| MACD (12,26,9) | 0.0879 / 0.1038 / −0.0159 | Dead cross on Oct 8 above the zero line; the Sep 15 golden cross has been reversed |
| ADX(14) | 16.0 | Below 20 — ranging, no directional regime (15.7 on the two-year frame) |
| ATR(14) | $0.230 (5.7%) | A wide daily range; 2×ATR spans 11.4% of the share price |
| OBV (2y / 90d) | early accumulation / accumulation | Above MA20 on both frames — flat on two years, rising on 90 days. Bullish OBV divergence on the 90-day frame |
| Volume vs 20d avg | 0.62× | 2,471,014 shares against a 3,963,793 average; roughly 0.84× after adjusting for a quiet market |
| 1×ATR / 2×ATR technical invalidation | $3.82 / $3.59 | Volatility-based structural reference levels below the close |
① Price & Moving Averages
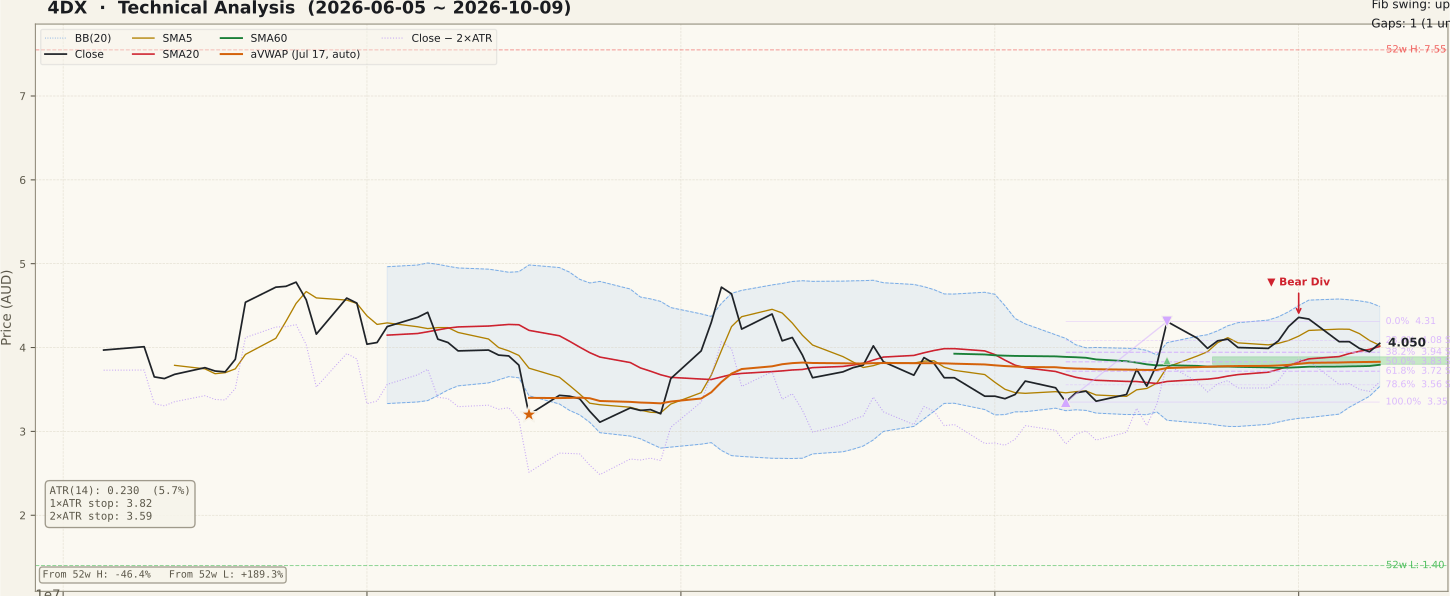
4DX_price-90d-2026-10-11.svgThe two-year chart sets the frame: after the April 2026 peak and the May drop, price has spent five months inside a broad range of roughly $3 to $4.70, and the SMA60 at $3.794 has flattened rather than rising. Within that, the 90-day view shows a September 8 low at $3.35, a jump to $4.31 on September 18, and a higher close of $4.36 on October 1. That swing produced the SMA20 > SMA60 crossover and the full SMA5 > SMA20 > SMA60 ordering on September 30.
The pullback since October 1 took price back below the 23.6% retracement of the Sep 8–Sep 18 swing ($4.08) and to $3.95 on October 8, just above the 38.2% level ($3.94). Friday's $4.05 close re-established price above both SMA20 and SMA60. The 50% retracement ($3.83) coincides almost exactly with the 90-day anchored VWAP ($3.830), and an unfilled gap from September 18 sits at $3.80–$3.89 — a layered support zone under the 20-day line. On the two-year Fibonacci (Apr 10 high $6.80 to Apr 30 low $4.01), the 23.6% retracement at $4.67 is the first overhead reference beyond the recent highs.
One piece of context on the September 18 bar: it fell on the S&P/ASX September quarterly rebalance trading day, when market-wide volume was elevated (universe median about 2.28× normal). 4DX was already an ASX 200 member before that date, and on a market-adjusted basis the bar's volume was about 1.46× rather than the raw 3.25×. The twenty-day-high break and the swing high that anchor this pullback both date from that bar.
② Volume

4DX_volume-90d-2026-10-11.svgFriday's 2,471,014 shares were 0.62× the 20-day average of 3,963,793. The whole ASX was quiet in the week (universe median volume ratios of 0.45× to 0.81×), so adjusted for that the bar was about 0.84× typical participation — at or below normal, not heavy. The 20-day average itself has drifted lower through September and October.
The higher-participation bars of the swing came on September 30 (+4.17%, about 1.34× market-adjusted) and October 1 (+2.59%, about 2.19×). The October 5 drop of 6.22% was on 0.74× raw volume, about 1.63× market-adjusted — noticeable, but well short of a heavy-volume break. No public catalyst was identified for these bars. The pullback days since then have been on lighter volume, which is consistent with a pause rather than distribution, but the recovery bar on Friday has not yet drawn volume either.
③ MACD

4DX_macd-90d-2026-10-11.svgMACD crossed above its signal line on September 15 from below zero, rose above zero, and peaked in early October. On October 8 it crossed back below the signal line: the current values are 0.0879 for MACD, 0.1038 for the signal and −0.0159 for the histogram. Both lines remain above zero, so this is a loss of momentum within a positive reading rather than a shift to negative territory. A pullback that resolves upward would normally show the histogram shrinking back toward zero first; a widening negative histogram would point to a deeper retracement.
④ RSI

4DX_rsi-90d-2026-10-11.svgRSI(14) is 53.0, back near the midline after peaking in the low 60s. A bearish divergence is flagged: price closed at $4.31 with RSI 63.92 on September 18, then at a higher $4.36 with RSI 62.96 on October 1. The gap between the two RSI readings is small, and the pullback since then has already worked off some of the momentum it described. A divergence is a possibility of a top, not a confirmation; it would gain weight if price closed below the 20-day line and the September lows came into play, and it would lose relevance on a new closing high above $4.36 with RSI above 63.92.
⑤ Mansfield Relative Strength

4DX_rs-90d-2026-10-11.svgMansfield RS versus the S&P/ASX 200 reads +11.9%, above zero with a rising slope tag. Against the prior week (+21.55) it has given back 9.69 points — positive but slowing — while against a month ago (−2.92) it is 14.77 points higher, having crossed back above zero during the September swing. On the two-year chart RS has compressed steadily from the very high readings of late 2025 to near zero over the summer, so the current reading is modest outperformance rather than leadership.
⑥ ATR & ADX

4DX_atr_adx-90d-2026-10-11.svgATR(14) is $0.230, or 5.7% of price — a wide daily range for a stock at this level, though ATR has been trending lower since the summer. That puts the 1×ATR reference at $3.82 and the 2×ATR technical invalidation level at $3.59, 11.4% under the close. ADX is 16.0 (15.7 on the two-year frame), below the 20 threshold: the market is not in a directional regime, and the moving-average ordering is forming inside a range rather than confirming a trend.
⑦ OBV

4DX_obv-90d-2026-10-11.svgOn the 90-day frame OBV is tagged accumulation — above its MA20 with a rising slope — and a bullish OBV divergence is flagged: price made a lower close of $3.95 on October 8 against $3.99 on September 28, while OBV made a higher reading (−2,585,170 versus −4,275,394). On the two-year frame OBV is tagged early accumulation, 0.41% above its MA20 with a flat slope. The two oscillators therefore point in opposite directions — RSI bearish on the highs, OBV bullish on the pullback low — and neither is confirmed by price yet. The 90-day OBV-to-MA20 gap of 88.94% reflects an MA20 close to zero and is not a measure of strength.
Bull Case vs Bear Case
Bull Case
- Close > SMA5 > SMA20 > SMA60, ordering in place since Sep 30; Friday's close re-took SMA20 and SMA60
- The pullback held above the 38.2% retracement ($3.94) of the Sep 8–Sep 18 swing
- Bullish OBV divergence: $3.95 on Oct 8 below $3.99 on Sep 28, with OBV higher (−2,585,170 vs −4,275,394)
- Layered support at $3.80–$3.89: Sep 18 unfilled gap, 50% retracement and the $3.830 90-day aVWAP
- Mansfield RS +11.9% versus the S&P/ASX 200, +14.77 points on the month
- Price above both anchored VWAPs — $3.354 (Aug 1, 2025) and $3.830 (Jul 17, 2026)
Bear Case
- MACD dead cross on Oct 8, histogram −0.0159
- Bearish RSI divergence: $4.31 at RSI 63.92 on Sep 18 against a higher $4.36 at RSI 62.96 on Oct 1
- ADX 16.0 — no directional regime; the larger chart has ranged between roughly $3 and $4.70 since May
- Close only 0.9% above SMA20, on volume about 0.84× market-typical
- Relative strength slowing: −9.69 points on the week
- ATR 5.7% of price; the 2×ATR invalidation line is 11.4% below and the 52-week high is 46.4% above
Scenarios
| Scenario | Probability | Path | Trigger / Invalidation |
|---|---|---|---|
| Pullback resolves upward | 35% | Price holds above the $4.01 SMA20, clears the $4.08 23.6% retracement, and retests the $4.31–$4.36 swing highs; the OBV divergence is confirmed and the MACD histogram turns back toward zero. | Trigger: a daily close above $4.36 with volume above its average. Invalidation: a daily close below $3.94. |
| Range continues | 40% | ADX below 20 is taken at face value: price oscillates between the $3.80–$3.89 support layer and the $4.31–$4.36 highs while the RSI and OBV divergences stay unresolved. | Trigger: daily closes between $3.83 and $4.36 with ADX below 20. Invalidation: a close outside either edge. |
| Pullback deepens | 25% | The MACD dead cross and the RSI divergence receive price confirmation: a close below the $3.83 aVWAP and 50% retracement, filling the Sep 18 gap, then a test of the $3.79 SMA60 and the $3.59 2×ATR level. | Trigger: a daily close below $3.80. Invalidation: recovery to a daily close above $4.08. |
Key Levels & Volatility References
| Level | Role | Distance | Basis |
|---|---|---|---|
| $4.49 | Resistance | +10.9% | Upper Bollinger Band (20) at 23.8% band width |
| $4.31 | Resistance | +6.4% | 90-day Fibonacci 0% anchor (Sep 18 high); the Oct 1 close of $4.36 sits just above |
| $4.05 | Current | — | Oct 9, 2026 close; the 23.6% retracement ($4.08) sits just above |
| $4.01 | Support | −0.9% | SMA20 / Bollinger mid line ($4.013), two-year Fibonacci 0% anchor ($4.01); SMA5 ($4.026) alongside |
| $3.83 | Support | −5.4% | 90-day aVWAP ($3.830, anchor Jul 17) and 50% retracement; Sep 18 unfilled gap $3.80–$3.89 and 1×ATR ($3.82) in the same zone |
| $3.79 | Support | −6.3% | SMA60 ($3.794) |
| $3.59 | Invalidation | −11.4% | 2×ATR technical invalidation level |
What to Watch
- The $4.01 SMA20. Friday's close re-took it by four cents. Closes that hold above it keep the pullback shallow; a slip back under it puts the $3.80–$3.89 support layer in play.
- The MACD histogram. At −0.0159 after the Oct 8 dead cross. A narrowing toward zero would suggest the pullback is ending; a widening would argue for a deeper retracement.
- The two divergences. A close above $4.36 with RSI over 63.92 would erase the bearish RSI divergence; a close below $3.95 would undo the bullish OBV divergence.
- Volume on up days. The recovery bar came on below-typical volume. A rise through $4.08 on above-average participation would carry more weight.
- ADX through 20. At 16.0 there is no directional regime; a turn up would indicate the moving-average ordering is becoming a trend.