Dicker Data Limited
This analysis is based on closing-price data as of July 31, 2026. Whether you're researching Dicker Data Limited (DDR) on the ASX or learning how to read stock charts, here are objective support, resistance and technical invalidation levels built from the RSI, MACD and ATR indicators.
Dicker Data closed Friday at $12.53, just 1.2% beneath its 52-week high of $12.68 after a powerful two-month advance that lifted the shares 51.3% off the May low of $8.68. The trend credentials are genuine — ADX at 33.6 marks a strong trend, and Mansfield relative strength of +22.1% versus the S&P/ASX 200 puts the stock firmly in the leadership camp. The complication is at the margin: the latest push toward the high arrived on just 0.66× average volume with a flagged RSI bearish divergence, so the attempt to clear the range top remains unconfirmed until participation returns.
Snapshot as of July 31, 2026 close
| Item | Value | Reading |
|---|---|---|
| Close | $12.53 | −1.2% from 52w high, +51.3% above 52w low |
| 52-week range | $8.28 – $12.68 | Pressing the top of the yearly range |
| SMA 5 / 20 / 60 | $12.44 / $12.11 / $11.21 | Bullish alignment — close above all three, all rising |
| Bollinger (20) | $11.49 / $12.11 / $12.73 | Band width 10.3% — close riding the upper half |
| aVWAP (2y) | $10.03 | Anchor Aug 29, 2025 — price well above |
| aVWAP (90d) | $11.75 | Anchor May 27, 2026 — price above |
| RSI (14) | 60.5 | Neutral-firm, but a bearish divergence is flagged |
| MACD (12,26) | 0.234 / signal 0.230 | Golden cross Jul 30 — histogram only +0.004 |
| Mansfield RS vs S&P/ASX 200 | +22.1% | Outperform (prev week 22.9 · prev month 19.7) |
| ADX (14) | 33.6 | Strong trend (2y frame: 33.1) |
| ATR (14) | $0.32 (2.6%) | Moderate daily range |
| OBV | 90d: above MA20, rising · 2y: above MA20, flat | 90d accumulation (+14.7%) · 2y early accumulation (+15.1%) |
| Volume vs 20-day avg | 0.66× (351,159 vs 529,788) | Below average at the highs — move unconfirmed |
| Volatility references | 1×ATR $12.21 · 2×ATR $11.88 | 2×ATR = technical invalidation level |
① Price & Moving Averages
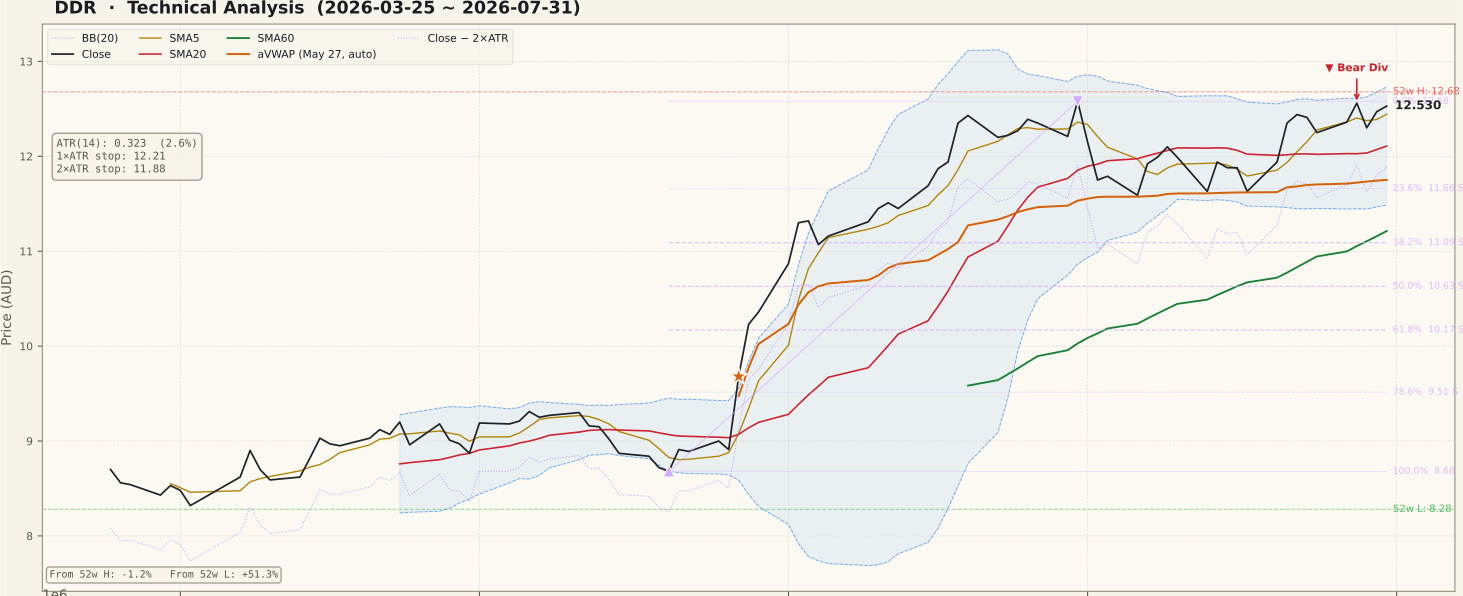
The two-year picture is a long sideways base near $8–$10 that resolved decisively in late May 2026: price broke out of the range, ran almost vertically through June, and has spent the last five weeks shelving sideways between roughly $11.80 and the $12.58 June 30 swing high. The moving-average stack is in full bullish alignment — close $12.53 above SMA5 ($12.44), SMA20 ($12.11) and SMA60 ($11.21), all three rising — which is the structure of an established uptrend, not a bounce. The 20-day average has now caught up to the consolidation and sits together with the Bollinger mid-band at $12.11, making that the nearest meaningful support retest zone below the market. Overhead, the ceiling is tightly stacked: the $12.58 swing high, the $12.68 52-week high and the upper Bollinger band at $12.73 all live within 1.6% of Friday's close. Because the recent Fibonacci swing is an up-leg (anchored $8.68 low, May 20 → $12.58 high, Jun 30), retracement levels below — 23.6% at $11.66 and 38.2% at $11.09 — act as deeper supports if the shelf gives way. No unfilled gaps remain on either timeframe.
② Volume

This is the honest weak point of the setup. Friday printed 351,159 shares against a 20-day average of 529,788 — a 0.66× ratio — and the tape has generally quietened as price crept back toward the 52-week high. Compare that with the June advance, where expansion days ran well above average and several spike sessions exceeded 2× the norm: that leg was paid for with real turnover, this approach so far is not. A textbook caution applies — a push through resistance on below-average volume is suspect, because thin participation is exactly the condition in which false range exits occur. Volume is the single most important confirmation variable this week: an expansion day back above the 20-day average through $12.58–$12.68 would validate the move, while another quiet drift into the highs keeps the risk of rejection elevated.
③ MACD

MACD printed a fresh golden cross on July 30, with the line at 0.234 edging above the signal at 0.230. Context matters: this cross comes after the June momentum extreme (MACD near 0.75) fully unwound through July, so it represents momentum re-engaging from a reset rather than a late-stage extension — structurally a healthier position. That said, the histogram is only +0.004, about as marginal as a cross can be, and both lines sit well below their June peak. One soft session could flip it back to negative, so this is a tentative early signal that needs follow-through, not standalone proof of a new leg. If the histogram widens over the next few sessions while price holds the $12.11 zone, the cross gains credibility.
④ RSI

RSI sits at 60.5 — firm but no longer stretched, a full retreat from the June readings above 80. The flagged issue is a classic bearish divergence: on June 19 price peaked at $12.43 with RSI at 85.6, while the marginally higher price high of $12.56 on July 28 could only muster RSI 62.9. Price made a higher high; momentum made a much lower one. That is a caution, not a verdict — a divergence signals the possibility of a top and needs confirmation from price itself (a rejection at the highs, a loss of support) before it counts as anything more. It can also be repaired: a genuine volume-backed thrust through the high that lifts RSI back toward 70 would neutralise the pattern. Until one of those resolutions arrives, the divergence argues against chasing strength at the range ceiling.
⑤ Mansfield Relative Strength

Mansfield RS versus the S&P/ASX 200 stands at +22.1% — deep in outperformance territory, and the zero-line crossover in late May coincided almost exactly with the price breakout, which is the pattern you want to see in a leadership name. The monthly trajectory is still improving: +22.1% against 19.7 a month ago is a gain of roughly +2.5 points, positive-zone acceleration. The weekly reading, however, has ticked down — +22.1% versus 22.9 last week, a slip of about −0.8 points — so relative momentum is cooling slightly at the one-week horizon even as the bigger arc keeps rising. That combination (monthly acceleration, weekly pause) is consistent with a stock digesting a large advance rather than surrendering leadership, but a second consecutive weekly decline would be an early deterioration flag worth respecting.
⑥ ATR & ADX

ADX reads 33.6 (33.1 on the two-year frame) — comfortably above the 25 threshold that marks a strong trend, though it has eased from the extreme readings printed during the June thrust. Remember ADX measures trend strength, not direction; here it is quantifying the up-move, and strong trends statistically resist reversal more often than they succumb to it. ATR(14) is $0.32, or 2.6% of price — a moderate daily range that has been drifting lower through the July consolidation, typical of a shelf forming after an expansion phase. That ATR anchors the objective risk math: the 2×ATR technical invalidation level sits at $11.88, about 5.1% below Friday's close, and a daily close beneath it would say the consolidation has failed on a volatility-adjusted basis rather than merely wobbled.
⑦ OBV (On-Balance Volume)

The two timeframes tell usefully different stories and both deserve stating. On the 90-day frame OBV is in outright accumulation: above its 20-day average, rising, with a +14.7% divergence reading — volume flow has supported the advance rather than fought it. On the two-year frame the picture is more tempered: OBV is above its average (+15.1% divergence) but the slope is flat and the absolute line still sits below zero, a legacy of the heavy distribution episode around September 2025 that the chart shows has only been partially rebuilt. The tag there is "early accumulation" — repair in progress, not completed. Net reading: near-term demand is genuine, but the longer-term volume base is still being reconstructed, which is another reason confirmation volume matters at the range ceiling.
Bull Case vs Bear Case
Bull Case
- Full bullish alignment: close $12.53 above SMA5 > SMA20 > SMA60, all rising — established uptrend structure.
- Mansfield RS +22.1% vs the S&P/ASX 200, with the monthly reading up ~+2.5 points — leadership, and still accelerating on that horizon.
- Fresh MACD golden cross (Jul 30) after a full July momentum reset — re-engagement from a healthier base, not a late extension.
- ADX 33.6 qualifies the advance as a strong trend, and strong trends resist reversal.
- 90-day OBV in accumulation — above a rising MA20 with a +14.7% divergence — so recent demand has been real.
- Price holds well above both anchored VWAPs ($11.75 on 90d, $10.03 on 2y): the average holder is in profit, thinning motivated overhead supply.
Bear Case
- The approach to the 52-week high is running on 0.66× average volume — a weak-volume push at resistance is suspect until participation confirms it.
- RSI bearish divergence: Jun 19 high $12.43 carried RSI 85.6, the Jul 28 higher high $12.56 only RSI 62.9 — momentum failed to confirm price.
- Weekly Mansfield RS slipped ~−0.8 points — early cooling of relative momentum inside the positive zone.
- Dense overhead: swing high $12.58, 52-week high $12.68 and upper Bollinger band $12.73 stack within 1.6% of the close.
- An extended tape — +51.3% above the 52-week low in about ten weeks and ~12% above SMA60 — leaves room for mean reversion even inside an intact trend.
- The MACD histogram is only +0.004 and the 2y OBV line remains below zero with a flat slope — both signals are marginal, not robust.
Scenarios
| Scenario | Probability | Path | Trigger / Invalidation |
|---|---|---|---|
| Volume-confirmed range exit | ~35% | An expansion day carries price through $12.58 and the $12.68 52-week high; the upper band opens and the June trend leg extends into new-high territory. | Trigger: daily close above $12.68 with volume back above the 20-day average (>1×). Invalidated by rejection at the highs on rising volume. |
| Sideways digestion | ~40% | Price shelves between the $12.11 support retest zone and $12.58 while the 20-day average rises underneath; the RSI divergence is repaired by time rather than price. | Trigger: continued holds of $12.11 on quiet pullbacks. Invalidated by a daily close below $12.11. |
| Divergence resolves lower | ~25% | Another rejection at the range ceiling, loss of $12.11, then a test of the $11.88 technical invalidation level and the 23.6% retracement at $11.66. | Trigger: close below $12.11 on above-average volume. A daily close below $11.88 (2×ATR) confirms structural failure of the consolidation. |
Key Levels & Volatility References
| Price | Role | Basis |
|---|---|---|
| $12.73 | R | Upper Bollinger band (20, 2σ) |
| $12.68 | R | 52-week high — top of the yearly range |
| $12.58 | R | Jun 30 swing high (0% of the May–Jun up swing) — nearest upside resistance level |
| $12.53 | Current | Jul 31 close |
| $12.11 | S | SMA20 / Bollinger mid-band confluence — nearest support retest zone |
| $11.88 | Invalidation | 2×ATR technical invalidation level (−5.1% from close) |
| $11.66 | S | 23.6% retracement of the $8.68 → $12.58 up swing |
What to Watch
- Volume on any push through $12.58–$12.68. Confirmation needs a day back above the 20-day average (>1×); another attempt at ~0.66× leaves the move suspect.
- How the RSI divergence resolves. RSI recovering toward 70 on strength neutralises it; a fresh price high with RSI stuck in the low 60s deepens it.
- Behaviour at $12.11. The SMA20 / mid-band zone is the first support retest zone — quiet, shallow tests keep the digestion scenario on track.
- Weekly Mansfield RS. A second consecutive week-on-week decline would turn the current pause into an early deterioration signal.
- A daily close below $11.88. The 2×ATR technical invalidation level — beneath it, the consolidation has failed on an objective, volatility-adjusted basis.