Data#3 Limited
This analysis is based on closing-price data as of July 31, 2026. Whether you're researching Data#3 Limited (DTL) on the ASX or learning how to read stock charts, here are objective support, resistance and technical invalidation levels built from the RSI, MACD and ATR indicators.
Data#3 sits just 4.3% below its 52-week high of $10.20 after a roughly 52% advance off the February–May base near $6.42, and it still ranks in the market's upper tier with a Mansfield RS reading of +9.7% versus the S&P/ASX 200. The last six weeks, however, look like a pause rather than a fresh leg: price is drifting sideways under the $9.94 June–July swing high while a bearish RSI divergence and a fresh MACD dead cross argue for a cooling-off phase. The working lens is a pullback within an intact uptrend — the $9.64–$9.46 support retest zone is where that framing is tested.
Snapshot as of July 31, 2026
| Item | Value | Reading |
|---|---|---|
| Close | $9.76 | −4.3% from 52w high, +52.0% above 52w low |
| 52-week range | $6.42 – $10.20 | Upper end of the yearly range |
| SMA 5 / 20 / 60 | $9.82 / $9.64 / $9.29 | Close just under SMA5; SMA20 > SMA60, both rising |
| Bollinger (20) | $10.04 / $9.64 / $9.23 | Band width 8.49% — mid-band contraction |
| aVWAP (2y anchor) | $8.02 (Dec 17, 2024) | Long-term holders well in profit |
| aVWAP (90d anchor) | $9.56 (May 27, 2026) | Recent cost basis just below price |
| RSI(14) | 55.3 | Neutral level, but bearish divergence flagged |
| Mansfield RS (vs the S&P/ASX 200) | +9.7% | Outperforming; weekly momentum cooling (prior week +12.3) |
| MACD(12,26) | 0.107 / signal 0.109 | Dead cross printed Jul 31; histogram −0.003 |
| ADX(14) | 19.1 | Ranging / weak trend strength |
| ATR(14) | $0.26 (2.6%) | Moderate daily volatility |
| OBV | 2y: above MA20, flat · 90d: above MA20, flat | Early accumulation on both frames |
| Volume (last session) | 667,394 vs 372,148 avg (1.8×) | Elevated turnover into the dead cross |
| 1×ATR / 2×ATR levels | $9.50 / $9.25 | 2×ATR = technical invalidation level |
① Price & Moving Averages
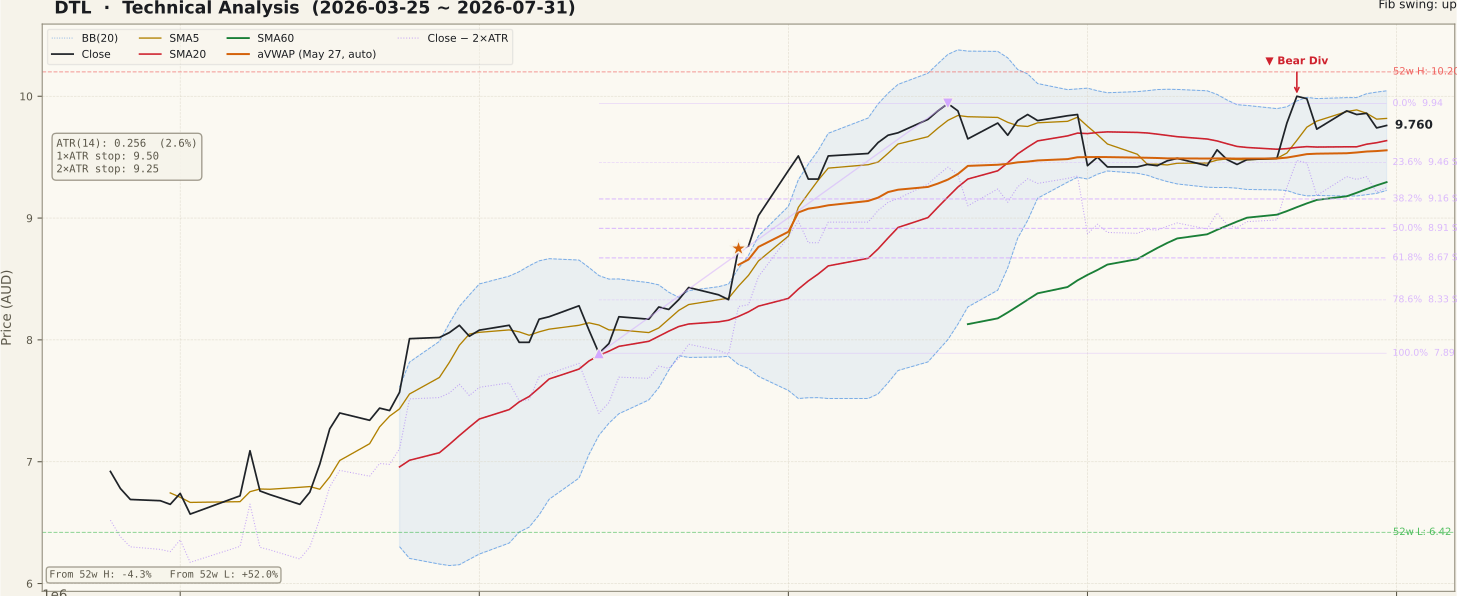
DTL_price-90d-2026-08-02.svgThe 90-day frame shows a staircase advance from the May low at $7.89 to the June 17 swing high at $9.94, followed by a six-week flat-top consolidation just beneath that high. The close at $9.76 holds above a rising SMA20 ($9.64) and a rising SMA60 ($9.29) — the alignment is still constructive even though price has slipped marginally under the SMA5. On the two-year chart the picture is a completed round trip: the March slide to the $6.42 area was fully recovered, and price is again pressing the top of the yearly range. Bollinger width at 8.49% is modest, consistent with a coiling range between $9.23 and $10.04 rather than a trending burst. The 23.6% retracement of the May–June swing sits at $9.46, framing a shallow support retest zone directly below the 20-day average.
② Volume

DTL_volume-90d-2026-08-02.svgThe final session printed 667,394 shares against a 20-day average of 372,148 — about 1.8× normal turnover — on the same day the MACD slipped into a dead cross. Elevated volume on a stalling day near range highs deserves respect: it can mark supply being absorbed, or supply winning. The June leg up was accompanied by two clear volume spikes on advancing days, which supports the view that the larger trend still has sponsorship. What would tip the balance bearishly is a sequence of heavier red sessions while price sits under $9.94; so far the tape shows alternation rather than one-sided distribution.
③ MACD

DTL_macd-90d-2026-08-02.svgMACD (0.107) crossed below its signal line (0.109) on July 31 — a fresh dead cross with a histogram of just −0.003. Two things temper the alarm: the cross occurred well above the zero line, which typically reads as momentum cooling inside an uptrend rather than trend reversal, and the histogram is barely negative, so the signal could flip back quickly. That said, the 90-day panel shows this is the second rollover from an elevated level — the late-June dead cross from ~0.45 already bled momentum through July. A deepening histogram from here would confirm the pullback has further to run; a snap-back above the signal line would neutralise it.
④ RSI

DTL_rsi-90d-2026-08-02.svgRSI(14) sits at 55.3 — neutral territory, down from overbought conditions in June. The flagged bearish divergence is specific: on June 25 price printed $9.85 with RSI at 79.55, and on July 22 price made a higher high at $10.00 while RSI managed only 69.36. Higher price, lower momentum — the classic signature of a tiring advance. A divergence is a possibility of reversal, not a confirmation; it needs follow-through (a break of support) before it counts as a top. For now the more measured reading is that RSI has reset from ~80 to the mid-50s while price gave back very little — often how strong stocks digest gains. Holding the 50 line on any further dip would keep the bullish structure intact.
⑤ Mansfield RS vs the S&P/ASX 200

DTL_rs-90d-2026-08-02.svgMansfield RS reads +9.7% — DTL has outperformed the S&P/ASX 200 and has held positive relative strength since early June, following a long stretch below zero through autumn. The nuance is in the rate of change: a week ago RS stood at +12.3, so the weekly change is −2.6 points — outperformance is slowing, not accelerating. Against a month ago (+9.1) the reading is essentially flat to slightly higher. Positive-but-slowing RS fits the pullback picture: the stock is still a market leader, but its edge over the index has stopped widening. A slide in RS back toward the zero line would be an early warning that this consolidation is resolving the wrong way.
⑥ ATR & ADX

DTL_atr_adx-90d-2026-08-02.svgATR(14) is $0.26, about 2.6% of price — moderate volatility that makes level-based planning practical. ADX at 19.1 (2y frame: 18.4) sits below the 20–25 formation band: the directional trend has gone quiet, which is exactly what a sideways consolidation should look like. Remember ADX measures strength, not direction — a low reading here says neither bulls nor bears currently control the tape. Volatility references derived from ATR: the 1×ATR level sits at $9.50 and the 2×ATR technical invalidation level at $9.25, just below the lower Bollinger band at $9.23. A range break accompanied by ADX turning up through 20 would signal the next trending phase, in whichever direction the break occurs.
⑦ OBV

DTL_obv-90d-2026-08-02.svgOBV tells the most constructive story on the page. On the 90-day frame it sits above its 20-day average (8,859,874 vs 7,866,801, a +12.6% spread) in an early-accumulation state, and the two-year frame agrees — OBV is above its average there too, with a wider +41.3% spread, having only recently reclaimed positive ground after a year underwater. Crucially, while price has churned sideways under $9.94 for six weeks, OBV has drifted to new highs rather than rolling over — volume flow is not confirming the bearish RSI divergence. The slope is flat rather than rising on both frames, so this is quiet absorption, not aggressive demand. If OBV loses its 20-day average during a price dip, the accumulation thesis weakens materially.
Bull Case
- Relative strength +9.7% vs the S&P/ASX 200 — still a market outperformer, positive since early June.
- Trend alignment intact: close above rising SMA20 ($9.64) and SMA60 ($9.29) after a +52% advance off the 52-week low.
- OBV in early accumulation on both frames, above its 20-day average and printing new highs while price consolidates.
- Only −4.3% from the 52-week high — shallow give-back so far; the 23.6% retracement at $9.46 has not even been tested.
- No unfilled gaps overhead; resistance is a clean, known band at $9.94–$10.20.
- MACD dead cross occurred well above the zero line with a near-zero histogram — cooling, not collapsing.
Bear Case
- Confirmed bearish RSI divergence: price $9.85 → $10.00 (Jun 25 → Jul 22) while RSI fell 79.6 → 69.4.
- Fresh MACD dead cross on July 31 — the second momentum rollover since late June.
- Weekly RS momentum cooling: +12.3 → +9.7 in a week; the outperformance edge has stopped widening.
- 1.8× average volume on the dead-cross session — possible supply showing up near range highs.
- ADX under 20 — no trend engine currently running; a six-week flat top can resolve either way.
- Layered overhead resistance: $9.94 swing high, $10.04 upper band, $10.20 52-week high — three ceilings within 4.5%.
Scenarios
| Scenario | Probability | Path | Trigger / Invalidation |
|---|---|---|---|
| Shallow reset, range resolves up | 45% | Price digests between $9.46 and $9.94; RSI cools toward 50 while OBV holds its average; an eventual push through $9.94 opens $10.04 and the $10.20 52-week high. | Daily closes holding the $9.64–$9.46 support retest zone; view strengthens on a close above $9.94 with above-average volume. |
| Deeper retracement within trend | 35% | The RSI divergence and dead cross extend the dip below the SMA20 toward $9.46, then the $9.26–$9.23 pocket (2×ATR reference / lower band), where the rising SMA60 converges. | A close below $9.64 on expanding red volume; the pullback framing survives as long as $9.25 holds on a closing basis. |
| Structural failure | 20% | A daily close below the $9.25 technical invalidation level breaks the pullback structure, exposing $9.16 (38.2% retracement) and $8.91 (50%), near where the 90-day aVWAP advance would fully unwind. | Close below $9.25 (2×ATR) — the objective line where the constructive reading is wrong. |
Key Levels & Volatility References
| Price | Role | Basis |
|---|---|---|
| $10.20 | Resistance | 52-week high |
| $10.04 | Resistance | Upper Bollinger band (20, 2σ) |
| $9.94 | Resistance | June 17 swing high · 0% of the up swing |
| $9.76 | Current | Close, July 31, 2026 |
| $9.64 | Support | SMA20 / Bollinger mid-band confluence |
| $9.46 | Support | 23.6% retracement of the $7.89 → $9.94 swing |
| $9.25 | Invalidation | 2×ATR technical invalidation level (−5.2% from close) |
What to Watch
- The $9.64–$9.46 support retest zone. Daily closes holding this band keep the shallow-pullback reading alive; losing $9.46 shifts odds toward the deeper retracement path.
- MACD histogram follow-through. A deepening negative histogram confirms the July 31 dead cross; a flip back positive within a few sessions would defuse it.
- OBV vs its 20-day average. The accumulation thesis rests on volume flow — OBV slipping below its average during a dip would remove the main bullish counterweight to the RSI divergence.
- Relative strength trajectory. RS cooled from +12.3 to +9.7 in a week; a continued slide toward the zero line would warn that leadership is rotating away.
- Behaviour at $9.94. A close above the swing high on above-average volume would end the divergence debate; repeated high-volume rejections there would strengthen the supply argument.