Sonic Healthcare Limited
This analysis is based on closing-price data as of July 31, 2026. Whether you're researching Sonic Healthcare Limited (SHL) on the ASX or learning how to read stock charts, here are objective support, resistance and technical invalidation levels built from the RSI, MACD and ATR indicators.
Sonic Healthcare has spent almost a year repairing the damage from its August 2025 gap-down, and the two-year chart still reads as a downtrend: the close of $21.86 sits 25.2% below the 52-week high of $29.24, with a large unfilled gap far overhead. The 90-day view is more constructive — a sequence of higher lows since the May base near $18.40, price above the 20- and 60-day averages, and relative strength versus the S&P/ASX 200 improving toward the zero line. The tension this week: a fresh MACD golden cross and early OBV accumulation argue for continuation, while a bearish RSI divergence at the July 29 swing high argues the rebound needs a rest first.
Snapshot as of July 31, 2026
| Item | Value | Reading |
|---|---|---|
| Close | $21.86 | −25.2% from 52w high · +19.7% above 52w low |
| 52-week range | $18.26 – $29.24 | Lower third of the range, recovering |
| SMA 5 / 20 / 60 | $22.10 / $21.57 / $20.21 | Close below SMA5 (short pause), above SMA20 and rising SMA60 |
| Bollinger (20) | $20.55 – $21.57 – $22.59 | Upper half of the band; width 9.4% |
| aVWAP (2y anchor Aug 21, 2025) | $21.53 | Price above — the post-gap supply zone has been absorbed |
| aVWAP (90d anchor May 29, 2026) | $20.58 | Price above — recent holders in profit |
| RSI(14) | 56.6 | Neutral-bullish, easing from 70; bearish divergence flagged |
| Mansfield RS vs the S&P/ASX 200 | −1.65% | Underperforming, but improving: −2.96 a week ago, −5.31 a month ago |
| MACD (12,26,9) | 0.41 / 0.37 (hist +0.04) | Golden cross Jul 29, early and shallow |
| ADX(14) | 26.0 | Strong trend reading |
| ATR(14) | $0.54 (2.5%) | Moderate volatility |
| OBV | 2y: above MA20 (+4.0%) · 90d: above MA20 (+13.5%) | Early accumulation on both timeframes, slope flat |
| Volume (last vs 20d avg) | 2.47M vs 1.67M (1.5x) | Above average into the pullback |
| Technical invalidation (1×/2×ATR) | $21.32 / $20.78 | Volatility-based references below the close |
① Price & Moving Averages
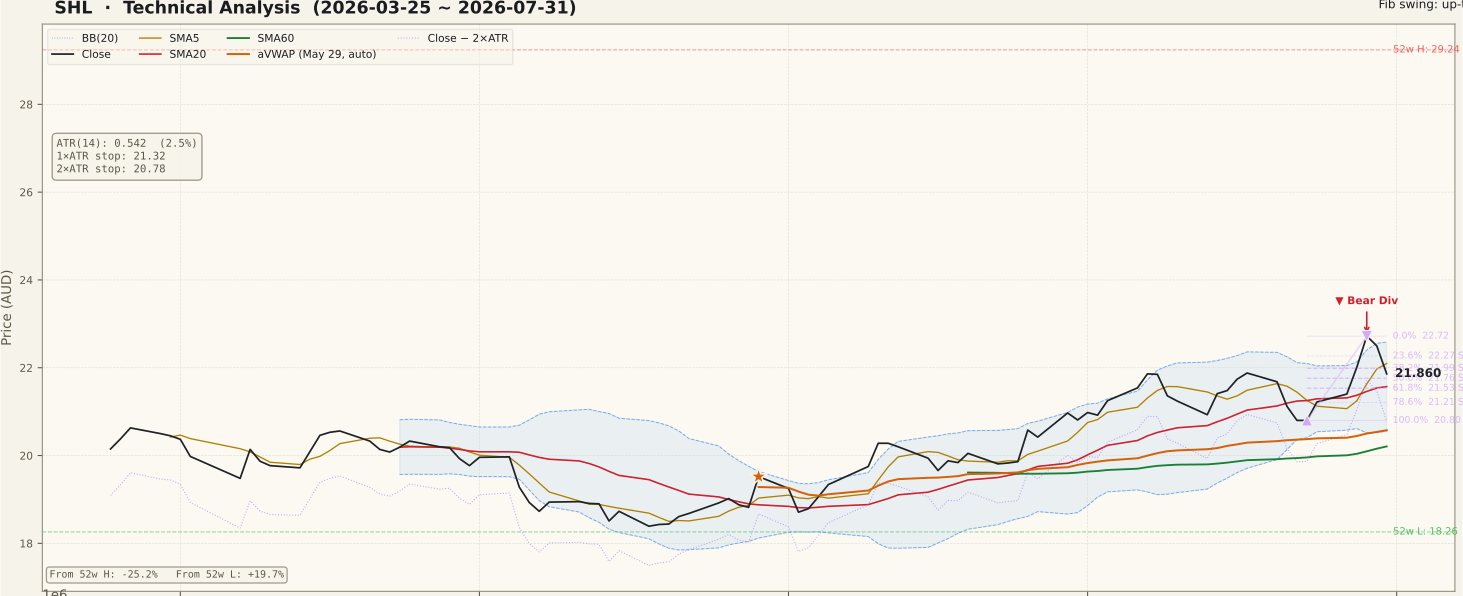
The two-year picture is a markdown-then-repair sequence: the August 2025 gap-down took SHL from the $28 area to the low $20s, a second leg bottomed at $18.26 in May–June 2026, and price has since climbed back through every short- and medium-term average. On the 90-day chart the structure is a clean uptrend of higher lows, and Friday's close of $21.86 is a pullback from the July 29 swing high of $22.72 that has so far held above the 20-day average at $21.57. The close slipped under the 5-day average ($22.10) — a short-term pause, not yet a structural break.
Two anchored VWAPs frame the recovery. Price is above both the 90-day aVWAP at $20.58 and, more notably, the two-year aVWAP anchored at the August 2025 gap ($21.53) — meaning the average holder through the entire markdown is no longer underwater, which reduces overhead supply pressure. The nearest structural test above is the $22.25–$22.27 zone, where the 61.8% retracement of the March swing ($23.86 → $19.65) overlaps the 23.6% retracement of the July advance. The March swing high at $23.86 and, much higher, the unfilled Aug 2025 gap at $28.00–$28.69 remain the longer-term ceilings.
② Volume

Friday printed 2.47M shares against a 20-day average of 1.67M — about 1.5x normal turnover, on a down day. Taken alone that is a caution flag; in context, the July advance has been accompanied by a healthy mix of above-average green sessions, so one heavy red bar reads as profit-taking into a known resistance zone rather than the start of distribution. What would change that reading is a run of consecutive heavy red sessions while price loses the $21.5s. Note that a single session's volume verdict is the least reliable signal on this page — the OBV section below aggregates the same information with less noise.
③ MACD

MACD (0.41) crossed back above its signal line (0.37) on July 29 — a golden cross, but a shallow one: the histogram is only +0.04 and the cross occurred well above the zero line after an extended run, which is the late-cycle variety rather than the powerful from-below type. The sequence over the past fortnight — dead cross mid-July, quick re-cross — describes a trend that is consolidating rather than reversing. A widening histogram from here would confirm the July uptrend has resumed; a failed cross that rolls back over within a few sessions would strengthen the divergence case outlined below.
④ RSI

RSI sits at 56.6 — comfortably neutral, cooled from the ~70 readings of late July. The flagged signal is a bearish divergence: on July 7 price closed at $21.86 with RSI at 74.3, and on July 29 price made a higher high at $22.72 while RSI printed only 69.5. Momentum did not confirm the new price high. This is a classic warning that a rally is tiring, and it is the strongest single argument for patience on this chart. Two caveats beginners often miss: a divergence is a possibility of reversal, not a confirmed one — it needs a follow-through break of support to matter — and divergences can resolve sideways through time rather than through a decline. RSI holding above ~45 on this pullback would suggest exactly that benign resolution.
⑤ Mansfield Relative Strength

Mansfield RS versus the S&P/ASX 200 reads −1.65% — still below zero, so SHL remains a market underperformer over the measured window. The direction of travel, however, is the story: RS was −5.31 a month ago and −2.96 a week ago, an improvement of +3.7 points on the month and +1.3 on the week. In the four-quadrant framing this is "negative but improving" — the stock is closing the gap on the index and is now pressing the zero line for the first time since the August 2025 markdown. A push into positive territory would mark a genuine character change; a stall and roll-over here, right at zero, is a pattern that has capped weaker names repeatedly. Until RS actually clears zero, treat SHL as a recovering laggard rather than a leader.
⑥ ATR & ADX

ADX at 26.0 is above the 25 threshold that denotes a strong trend — and on the 90-day chart the prevailing trend is up, so trend-strength currently works in the bulls' favour. Remember ADX measures intensity, not direction; the same reading during the May decline described strong downside pressure. ATR(14) is $0.54, or about 2.5% of price — a moderate daily range for an ASX 100 name, though the ATR line has ticked up during the latest pullback, showing the two-way fight around $22. That 2.5% figure anchors the volatility references on this page: the 2×ATR technical invalidation level sits at $20.78, roughly 5% below Friday's close, which is the distance normal noise could plausibly travel without the recovery structure being broken.
⑦ OBV (On-Balance Volume)

Both timeframes carry an early accumulation tag: OBV is above its 20-day average on the two-year view (+4.0% divergence) and more decisively on the 90-day view (+13.5%), where cumulative volume has been making higher highs alongside price since June. The chart also flags an OBV bullish divergence into the June low — volume flows turned up before price did, which is what genuine demand usually looks like. The tempering detail is that OBV slope is currently flat on both frames: the accumulation is real but not accelerating, and the 90-day OBV set its recent peak with price in late July. Watch whether OBV holds above its MA20 through this pullback — that would confirm holders are sitting tight rather than distributing.
Bull Case
- 90-day uptrend of higher lows from the $18.40 base; close above SMA20 ($21.57) and a rising SMA60 ($20.21)
- MACD golden cross on Jul 29 with the histogram back in positive territory on both timeframes
- Mansfield RS improving fast — from −5.31 a month ago to −1.65, now pressing the zero line
- OBV above its MA20 on both frames (90d divergence +13.5%) with an early-accumulation tag and a bullish OBV divergence at the June low
- Price above both anchored VWAPs, including the two-year anchor at $21.53 — post-gap overhead supply largely absorbed
- ADX 26.0 signals a strong trend, and the prevailing 90-day trend is up
Bear Case
- Bearish RSI divergence: Jul 29 higher high at $22.72 with RSI 69.5 vs 74.3 at the Jul 7 peak — momentum did not confirm
- Two-year structure is still a downtrend: −25.2% below the 52-week high with lower highs since August 2025
- Mansfield RS remains negative (−1.65%) — SHL is still an ASX 200 underperformer until it proves otherwise
- Fibonacci confluence at $22.25–$22.27 directly overhead, then the March swing high at $23.86
- Friday's pullback came on 1.5x average volume — heavy turnover on a red session at resistance
- Unfilled Aug 2025 gap at $28.00–$28.69 marks a major long-term supply ceiling; OBV slope is flat, not accelerating
Scenarios
| Scenario | Probability | Path | Trigger / Invalidation |
|---|---|---|---|
| Constructive continuation | ~45% | The pullback holds the $21.53–$21.76 support cluster (fib 50–61.8%, SMA20, 2y aVWAP), the divergence resolves through time, and price clears the $22.25–$22.27 confluence toward $22.72, then the $23.86 March swing high. | Trigger: daily close above $22.27 on above-average volume. Weakens on a close below $21.53. |
| Deeper retracement, base intact | ~35% | The RSI divergence plays out: price loses $21.53 and works down toward $21.21 (fib 78.6%) or the $20.80 swing low, near the 90-day aVWAP at $20.58, where the uptrend gets a full reset. | Trigger: close below $21.53. The recovery structure survives while daily closes stay above $20.78. |
| Failed recovery | ~20% | Distribution takes over — heavy-volume red sessions stack up, the $20.80 swing low goes, and the 2×ATR technical invalidation level at $20.78 is closed below, re-opening the path toward the $19.65 March low. | Trigger/invalidation: daily close below $20.78 (2×ATR) negates the recovery thesis. |
Key Levels & Volatility References
| Price | Role | Basis |
|---|---|---|
| $23.86 | Resistance | March 2 swing high · 100% retracement of the March decline |
| $22.72 | Resistance | July 29 swing high · anchor of the current pullback |
| $22.25–$22.27 | Resistance | Fib confluence: 61.8% of the March swing + 23.6% of the July advance (BB upper $22.59 just above) |
| $21.86 | Current close | Jul 31 close · between the confluence zones |
| $21.76 | Support | 50% retracement of the July advance ($20.80 → $22.72) |
| $21.53 | Support | 61.8% retracement · 2-year aVWAP $21.53 · SMA20 $21.57 cluster |
| $20.78 | Invalidation | 2×ATR technical invalidation level below the close (1×ATR reference: $21.32) |
What to Watch
- The $21.53–$21.76 cluster. Fib 50–61.8%, SMA20 and the two-year aVWAP all sit here — how this zone behaves decides which scenario is running.
- Mansfield RS at the zero line. A cross into positive territory would be the first outperformance signal in nearly a year; a rejection at zero keeps SHL a laggard.
- RSI follow-through. The bearish divergence matters only if support breaks — RSI holding above ~45 on this pullback would defuse it.
- OBV vs its MA20. Accumulation is early and flat; OBV slipping below its average alongside more 1.5x-volume red sessions would flag distribution.
- A daily close below $20.78 — the 2×ATR technical invalidation level — would negate the recovery structure regardless of the other signals.