Neuren Pharmaceuticals Limited
$18.00 −21.7% from the 52-week high ($22.99) · +63.6% above the 52-week low ($11.00)
This analysis is based on closing-price data as of July 31, 2026. Whether you're researching Neuren Pharmaceuticals Limited (NEU) on the ASX or learning how to read stock charts, here are objective support, resistance and technical invalidation levels built from the RSI, MACD and ATR indicators.
Neuren's two-year chart is a full round trip: a powerful advance to $22.99 by late 2025, a February gap-down and multi-month base near $12, then a violent late-June gap back up to the $17 area — the kind of one-week repricing that, in a biotech, usually traces back to a clinical or regulatory catalyst rather than the chart itself. After five weeks of sideways digestion between roughly $16.50 and $17.75, Friday's close at $18.00 cleared the 20-day high on 1.6x average volume, with relative strength versus the S&P/ASX 200 freshly positive and accelerating. The complication: both RSI and OBV are flagging bearish divergences, so this breakout is starting life without full confirmation from momentum or volume flow.
Snapshot as of July 31, 2026
| Item | Value | Reading |
|---|---|---|
| Close | $18.00 | Highest close of the post-gap range |
| 52-week high / low | $22.99 / $11.00 | −21.7% from high · +63.6% from low |
| SMA 5 / 20 / 60 | $17.27 / $16.93 / $14.77 | Bullish stack — close above all three, rising |
| Bollinger (20) | $17.82 / $16.93 / $16.04 | Close above the upper band; width 10.5% |
| aVWAP — 2y anchor | $13.65 (anchored Feb 3, 2026) | Price well above the long-horizon anchor |
| aVWAP — 90d anchor | $16.95 (anchored Jun 29, 2026) | Average post-gap holder is in profit |
| RSI(14) | 66.7 | Firm but below overbought — bearish divergence flagged |
| Mansfield RS (vs the S&P/ASX 200) | +7.6% | Outperforming, slope rising |
| MACD(12,26) | 0.63 vs signal 0.67 | Dead cross Jul 20; histogram −0.04, both lines well above zero |
| ADX(14) | 23.9 | Emerging trend (20–25 band) |
| ATR(14) | $0.74 (4.1% of price) | Elevated volatility — size expectations accordingly |
| OBV (2y / 90d) | −2,285,753 / −1,445,799 | Both above MA20, slope flat — early accumulation tag, unconfirmed |
| Volume | 674,686 vs 20-day avg 423,298 | 1.59x average on the range break |
| 1× / 2×ATR invalidation | $17.26 / $16.52 | Volatility-based technical invalidation references |
① Price & Moving Averages
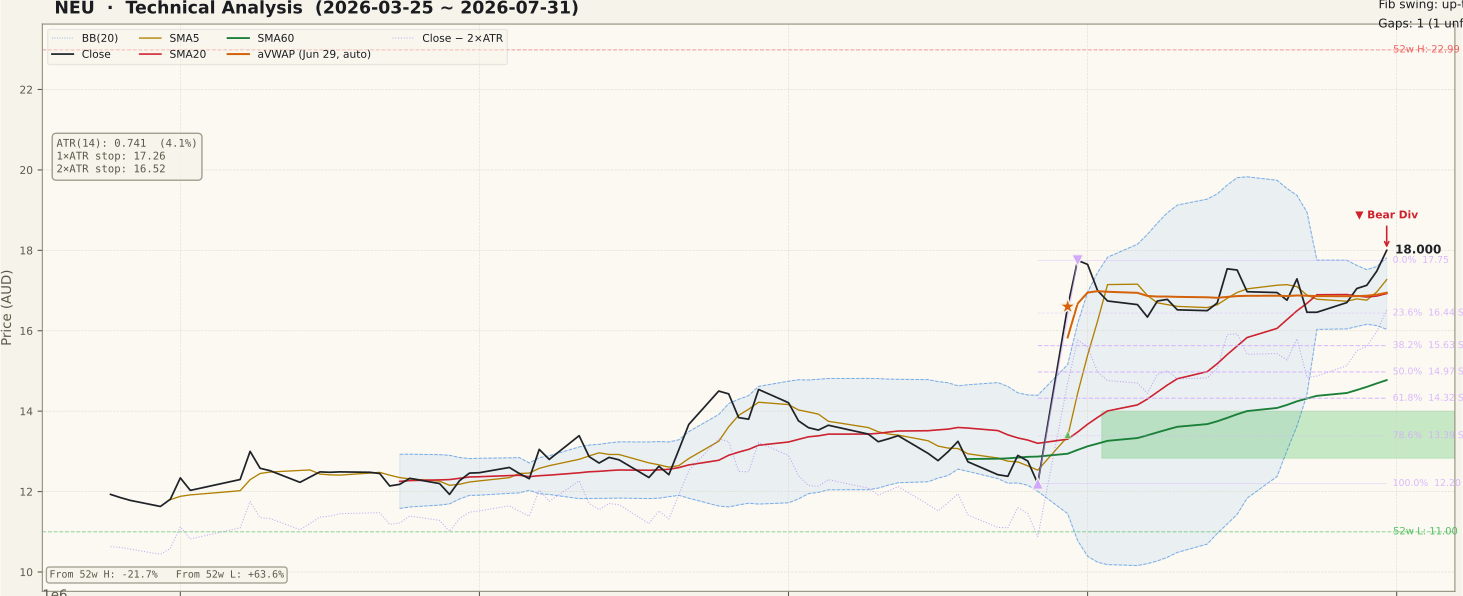
The 90-day window splits cleanly in two: a flat $12–$13 base through April, May and most of June, then the June 29 breakaway gap that lifted the stock from a $12.20 swing low (Jun 26) to a $17.75 swing high (Jun 30) in three sessions, leaving an unfilled support gap at $12.83–$14.00 below. Since then price has built a five-week shelf between roughly $16.44 and $17.75, riding just above the 90-day anchored VWAP at $16.95 — the average buyer since the gap has stayed modestly in profit, which limits trapped-supply pressure. Friday's $18.00 close cleared the 20-day high and the June 30 swing high, with the moving averages in a clean bullish stack (close > SMA5 $17.27 > SMA20 $16.93 > SMA60 $14.77) and the close finishing above the upper Bollinger band at $17.82 after the 10.5%-wide squeeze — typically the signature of a range resolving, though a close outside the band can also mean short-term stretch. On the two-year view the context is humbler: this move is a recovery leg, still 21.7% below the $22.99 high, so holders from the October 2025 – January 2026 zone sit overhead as potential supply on the way back up.
② Volume

Friday printed 674,686 shares against a 20-day average of 423,298 — a 1.59x ratio, which gives the range break above-average, if not spectacular, participation. The June 29 gap itself came on the largest volume bars of the window (multiple 2x+ spikes), which is what you want to see behind a breakaway gap: broad repricing, not a thin drift. Turnover has since cooled to normal levels through the July shelf, a constructive pattern (heavy on the move, quiet in the consolidation). One ASX-specific caveat for a biotech: material announcements here routinely arrive via trading halts, so gaps and blank sessions on this chart are a feature of the landscape, and any follow-through on this breakout should keep printing at least average volume to stay credible.
③ MACD

MACD is the most cautious panel. A dead cross printed on July 20, and as of Friday the MACD line (0.63) still sits just below its signal (0.67) with a histogram of −0.04. Context matters, though: both lines remain far above the zero line, so this reads as momentum cooling inside an uptrend — the natural echo of a five-week sideways shelf after a vertical move — rather than a trend ending. The histogram bars have been shallow and are no longer deepening, and Friday's push to new range highs is exactly the kind of price action that, if it holds, is usually followed by the lines re-crossing to the upside. Until that re-cross appears, the breakout is running slightly ahead of its momentum confirmation, which is worth respecting.
④ RSI

RSI(14) sits at 66.7 — firm, but short of the 70 overbought line, so the reading itself is unremarkable. The flag is the divergence: on June 30 price hit $17.75 with RSI at 75.63, and on July 31 price made a higher high at $18.00 while RSI printed only 66.7. Higher price, lower momentum — a textbook bearish divergence, and it is corroborated rather than contradicted by the OBV panel below. Two qualifications keep this honest. First, a divergence is a possibility of exhaustion, not a confirmed reversal — after a 45% vertical move, RSI almost always cools on the retest of the highs, and divergences resolve harmlessly when price keeps closing higher. Second, the signal only gains teeth on downside follow-through, such as a close back inside the old range below $17.75. Watch whether RSI can push back through 70 with price; that would neutralise the pattern.
⑤ Mansfield Relative Strength

Mansfield RS versus the S&P/ASX 200 stands at +7.6%, in outperform territory with a rising slope. The acceleration is notable on both clocks: a week ago the reading was +0.6 (a +7.0-point weekly gain) and a month ago +1.9 (a +5.7-point monthly gain) — positive and accelerating on both, which is the strongest of the four RS regimes. The nuance is youth: NEU spent most of this 90-day window deep in negative territory (around −20 to −25) and only crossed above zero with the late-June gap. Leadership this new is real but untested — it reflects one repricing event plus five weeks of holding the gains, not a long institutional ownership campaign. A sustained hold above the zero line through any pullback would upgrade this from event-driven strength to durable relative leadership.
⑥ ATR & ADX

ATR(14) is $0.74, or 4.1% of price — an average day here moves what many industrials move in a fortnight, and that volatility budget should anchor any risk framing. The volatility-based references land at $17.26 (1×ATR below the close) and $16.52 (2×ATR), the latter serving as this analysis's technical invalidation level: a close below it would mean the breakout has given back more than two average days' range, which historically is noise no longer. ADX at 23.9 sits in the 20–25 "emerging trend" band and has been curling up from the July lull — directional energy is building but a strong trend is not yet certified (and remember ADX measures strength, not direction). For a biotech, treat the 4.1% ATR as a floor on expectations: a single announcement can move this stock multiples of its ATR in either direction, straight through any nearby level.
⑦ OBV

OBV carries the same tag on both timeframes — early accumulation, meaning OBV is above its 20-day average (90d: −1,445,799 vs −2,879,010, a 49.8% divergence above the MA; 2y: −2,285,753 vs −3,718,964, 38.5% above) — but the slope is flat on both, and that flatness is the story. Price is at post-gap highs while cumulative volume flow has merely stopped deteriorating rather than turned decisively up: the chart flags this as a bearish non-confirmation, echoing the RSI divergence. The absolute OBV level is also still negative on both windows, so the June–July recovery has not yet rebuilt the flow that the February–March decline drained. The constructive read is that OBV basing above its MA while price consolidates is how accumulation phases often start; the sceptical read is that a breakout without an OBV thrust invites failure. An upturn in OBV slope over the next one to two weeks would settle the argument in the bulls' favour.
Bull Case vs Bear Case
Bull Case
- Clean bullish MA stack — close $18.00 above SMA5 $17.27, SMA20 $16.93 and SMA60 $14.77, all rising.
- Range break above the $17.75 June swing high on 1.59x average volume after a five-week consolidation.
- Mansfield RS +7.6% vs the S&P/ASX 200 — positive and accelerating on both weekly (+7.0 pts) and monthly (+5.7 pts) clocks.
- Unfilled breakaway support gap at $12.83–$14.00 — a strength signature that has held for five weeks.
- OBV above its 20-day MA on both timeframes (early accumulation tag) with post-gap holders in profit above the $16.95 anchored VWAP.
- Close above the upper Bollinger band out of a 10.5% squeeze, with ADX 23.9 turning up toward trend territory.
Bear Case
- Bearish RSI divergence — price $17.75→$18.00 higher high while RSI faded 75.63→66.7.
- OBV bearish non-confirmation — flat slope and still-negative absolute level while price sits at post-gap highs.
- MACD dead cross on July 20 with the histogram still negative (−0.04) — momentum has not yet re-confirmed the breakout.
- Still 21.7% below the $22.99 52-week high — overhead supply from late-2025 holders sits across the path higher.
- ATR 4.1% plus biotech announcement sensitivity — one clinical or regulatory headline can gap through nearby levels in either direction.
- The breakout is one session old and closed outside the upper band — short-term stretched, with the 2×ATR invalidation 8.2% below at $16.52.
Scenarios
| Scenario | Probability | Path | Trigger / Invalidation |
|---|---|---|---|
| Follow-through | 45% | The shelf top at $17.75 flips to a support retest zone; MACD re-crosses upward and RSI reclaims 70; price works higher through the empty zone toward the $22.99 52-week-high resistance area. | Trigger: daily closes holding above $17.75 on at least average volume, with OBV slope turning up. Invalidated by a close back below the $16.93 SMA20. |
| Retest and pause | 35% | The RSI/OBV divergences bite first: price slips back inside the range and rebuilds between the $16.44 fib 23.6% level and $17.75, near the $16.95 anchored VWAP, before any second attempt. | Trigger: a close back below $17.75 within days of the break. As long as closes hold above $16.52, structure stays constructive. |
| Failed break | 20% | A close below the 2×ATR technical invalidation level at $16.52 negates the breakout; attention shifts down the fib ladder to $15.63 (38.2%) and $14.97 (50%), with the gap top at $14.00 the deeper backstop. | Trigger: daily close below $16.52 — or any adverse company announcement, which in a biotech can bypass technical levels entirely. |
Key Levels & Volatility References
| Price | Role | Basis |
|---|---|---|
| $22.99 | Resistance | 52-week high (late 2025 peak) — the major overhead reference |
| $18.00 | Current | Fri, Jul 31 close — above the five-week range top |
| $17.75 | Support | June 30 swing high (fib 0% anchor) — broken range top, now the immediate support retest zone |
| $17.26 | Reference | 1×ATR below close — normal single-day volatility reach |
| $16.93 | Support | SMA20 / Bollinger mid, with the 90d anchored VWAP at $16.95 — post-gap value cluster |
| $16.52 | Invalidation | 2×ATR technical invalidation level — a close below negates the breakout structure |
| $16.44 | Support | Fibonacci 23.6% retracement of the $12.20 → $17.75 up swing |
What to Watch
- Closes versus $17.75 — daily closes holding above the old range top keep the breakout alive; a quick slip back inside the range is the divergence warning coming true.
- Volume on follow-through — continuation days should print at or above the 423,298-share 20-day average; a fading tape into higher prices would repeat the OBV concern.
- OBV slope and MACD re-cross — an OBV upturn plus a fresh MACD golden cross would clear both open non-confirmations at once.
- RSI behaviour near 70 — a push through 70 alongside new price highs neutralises the bearish divergence; repeated lower RSI highs deepen it.
- Company announcements and trading halts — for a biotech, check the announcement feed before reading any large gap or halt as a purely technical event.